Background to the mystery ^
I have a server that has an SSD and an NVMe device which I intend to put into a two device RAID array. Since these devices have dramatically different performance characteristsics I did some basic tests to see which configuration would be best.
I’ve noticed that Linux’s MD RAID-10 sometimes performs much worse than MD RAID-1. This does not make much sense to me and I wondered why.
Update: the answer seems to have been found.
I’ve done some more tests and also included testing against some regular rotational HDDs just for comparison, even though I don’t intend to use them in the same way as the flash devices.
Results ^
Visuals first; testing details later. Some brief explanation of terms though.
- Fast RAID
- A RAID array composed of the two flash devices. One of them is an SSD and the other is an NVMe. While both of these devices are much much faster than HDDs, NVMe is again much faster than SSD so this is an imbalanced array.
- Slow RAID
- A RAID array composed of the two 5.4kRPM SATA HDDs. This is just for comparison. They are really, painfully, laughably slow compared to flash devices.
Charts ^
Click on the thumbnails to get a full size image. If you’re impatient, skip to the interesting bit.
Sequential IO ^
Flash devices
Reads

RAID-10 appears to work very well for sequential read IO. Remember these are mismatched devices; when reads come from both, things are not going to perform as well as the fastest device (NVMe). Still, RAID-10 achieves nearly 3.5 times the throughput of SSD alone and has some redundancy.
Why is RAID-10 1.36x faster than RAID-1 here? I’ve read that Linux RAID-10 can stripe a single process’s IO across multiple devices whereas with RAID-1 each process gets one device to read from. I’m not sure how that can apply here though, as these are 4KiB IOs which seem unlikely to be split between devices.
Looking at the raw fio output, for RAID-1 ~77% of the IOs went to the NVMe. For RAID-10 ~86% of the IOs went to the NVMe. So that is an explanation of sorts: if you get more of your IO from a faster device, your IO obviously ends up faster. It does not explain why RAID-10 is better at directing sequential IO than RAID-1 is though.
Writes
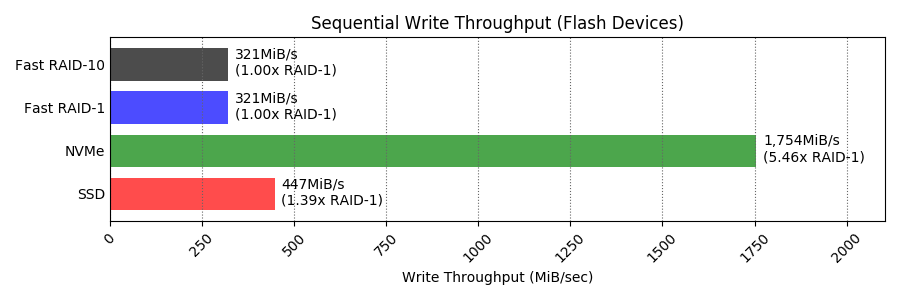
Here we can see that both kinds of RAID perform the same and definitely introduce overhead – they’re both about 72% the speed of the slowest device (the SSD). Still, for many uses you may not notice the difference, and the redundancy is required.
Rotational devices
Read
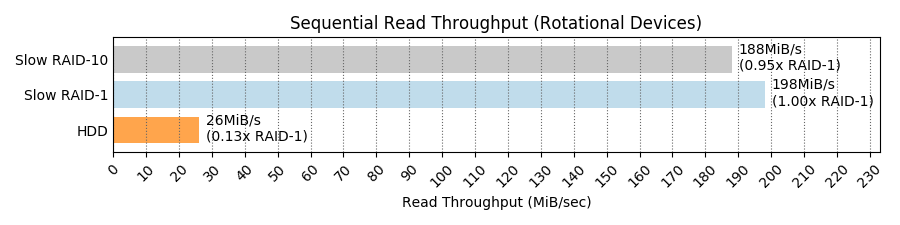
Any kind of RAID here is doing wonders for sequential read performance. I have no idea how or why RAID-10 can be over 7x faster than a single HDD. The RAID-1 is 5% slower than RAID-10 but it’s unclear if that’s significant or within bounds of test error.
It feels like a cache is involved here. Direct IO is being used but that’s only going to bypass the Linux page cache. Are the HDDs themselves caching this? They only have 128MB of cache though. Is there a read-ahead somewhere that is helping?
Write

This one is looking a lot more how I would expect. Again both RAIDs are going a little slower than the slowest device. This time it’s the RAID-10 that is about 6% faster, but again this could be within the bounds of error.
Random IO ^
Flash devices
Read
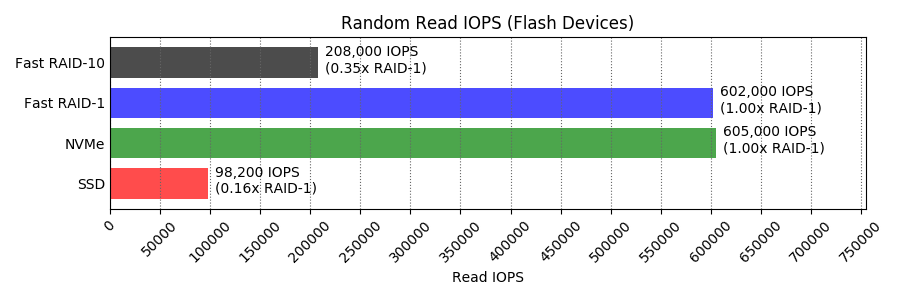
This is exactly the kind of WTF that prompted me to look into this more deeply. Why is RAID-10 about a third the random read performance of RAID-1!?
Update: the answer seems to have been found.
If using RAID-1 it is nice to see that you can pair an omg-my-wallet SSD with a slightly less omg-my-wallet NVMe and still get close to the NVMe levels of random read performance. Looking at the raw fio output, ~84% of the IOs hit the NVMe side of the mirror.
Looking at those stats for the RAID-10, the NVMe side got 53% of IOs. I don’t know if it is deliberate but I don’t think that Linux RAID-10 is able to source these IOs from the fastest device, to its massive detriment when there is such a big disparity. RAID-10 random read has ended up about twice the performance of the slowest device, but when the fastest device is more than 6 times faster than the slowest one you’d really like to get nearer to the fastest one!
Write
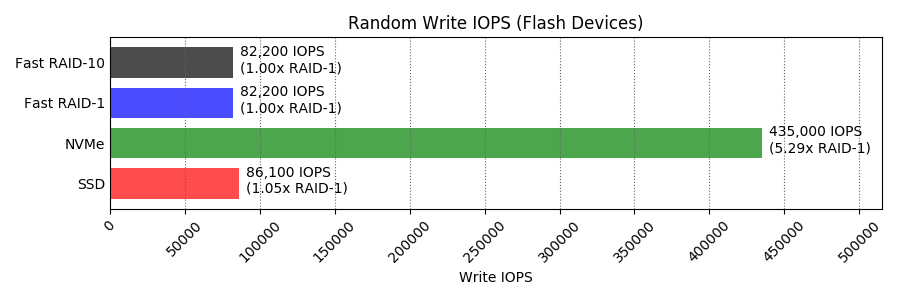
Things return to expectations with random writes. Both kinds of RAID perform about as fast as the slowest device, I guess because Linux has to wait for writes on both sides of the mirror to complete.
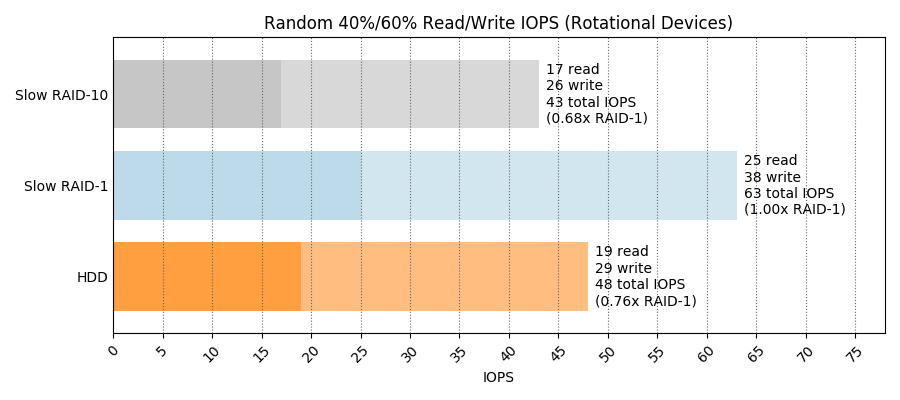
40%/60% read/write
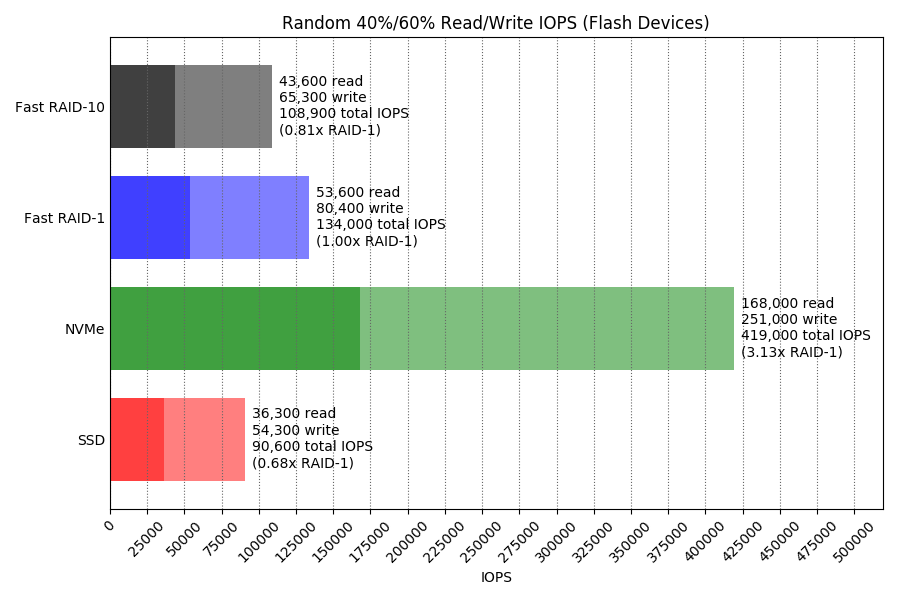
Here RAID-10 is ~20% slower than RAID-1. I think this is because on RAID-1 the (smaller percentage of) read IOs are benefiting from whatever we see above for the pure random read test, while the (larger percentage of) write IOs are performing the same for both RAID-1 and RAID-10.
Looking at the raw fio output, for RAID-1 the NVMe device got 94% of the read IOs! They split the write IOs 50/50 as you’d expect since both sides have to have a copy written.
Looking at the output for RAID-10, the NVMe device got 50% of the read IOs. It’s easy to see why performance is lower here for RAID-10, though still not clear to me if this is by design and generally known.
This 40/60 split of read/write may seem an odd benchmarking choice but it’s actually fairly representative of our busiest VM hosting servers.
75%/25% read/write
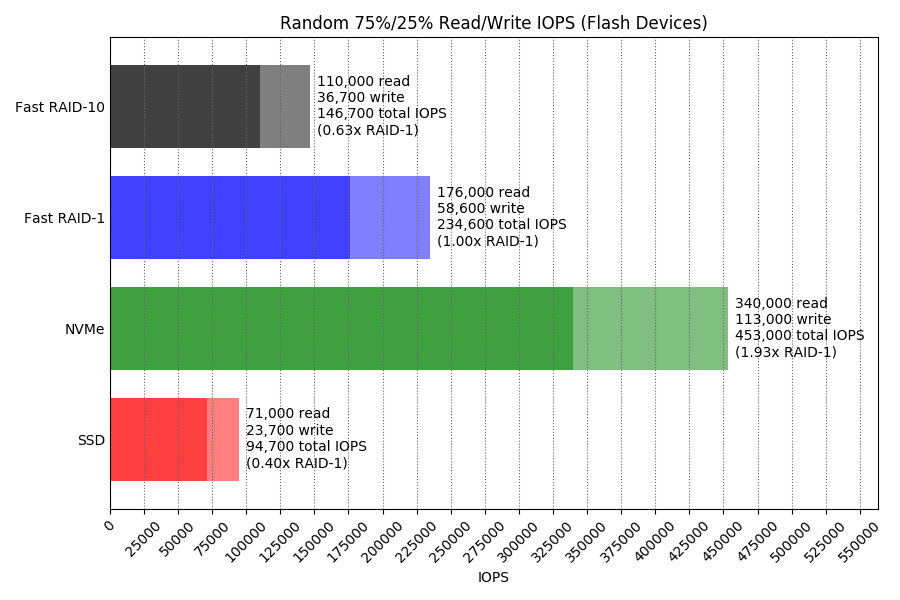
The more usual random 75%/25% read/write test also bears out the same evidence that RAID-1 reads are happening at close to the speed of the fastest device while RAID-10 reads are happening only a bit faster than the slowest device.
Rotational devices
Read
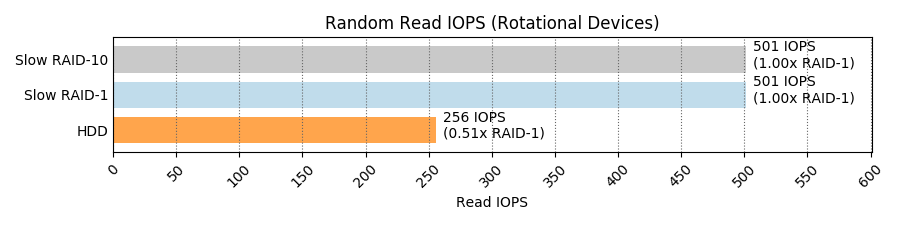
There’s something wrong with this test. Again I suspect it’s hitting a cache somewhere because a 5.4kRPM SATA HDD is not capable of 256 IOPS! It should max out at about a quarter of this.
If someone could give me some hints as to what might be wrong with this test I’d appreciate it. To recap, it’s doing random 4KiB IO with 4 processes across an 8GiB file, so in total 32GiB will be read. In fio, the libaio engine with direct=1 is used, in an attempt to bypass Linux page cache.
Looking at the raw fio output:
  IO depths    : 1=0.1%, 2=0.1%, 4=0.1%, 8=0.1%, 16=0.1%, 32=100.0%, >=64=0.0%
     submit    : 0=0.0%, 4=100.0%, 8=0.0%, 16=0.0%, 32=0.0%, 64=0.0%, >=64=0.0%
     complete  : 0=0.0%, 4=100.0%, 8=0.0%, 16=0.0%, 32=0.1%, 64=0.0%, >=64=0.0%
     issued rwts: total=922360,0,0,0 short=0,0,0,0 dropped=0,0,0,0
     latency   : target=0, window=0, percentile=100.00%, depth=32

[…]

Disk stats (read/write):
sdd: ios=922292/3, merge=27/1, ticks=217720971/727, in_queue=113860764, util=98.94% |
So that is 922,360 read IOs issued, and 922,292 of them actually hit the disk. As far as I am aware that means close to zero of them came out Linux’s page cache; if there is caching involved does that mean it can only be the drive’s own cache?
As far as replicating this RAID-10 random read performance hole, both RAID-1 and RAID-10 sent about half the IOs to each device so it won’t show itself even if I do fix the test.
Write
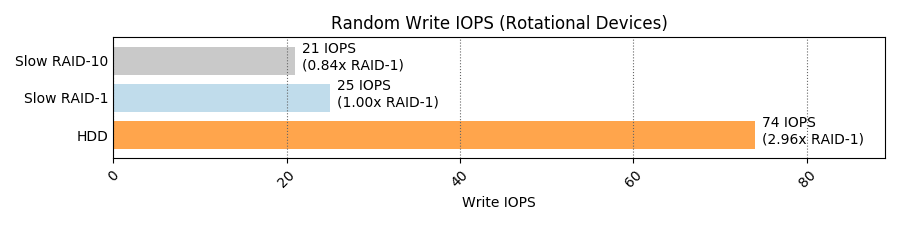
Now this brings me back to the safe and comfortable (as long as I don’t have to actually live there) lands of HDD performance. I can believe that the HDD does 57 write IOPS, maybe with a little help from its own write cache. I don’t know why RAID-1 performs about a third as fast as a single device (why not the same as the slowest device?). Maybe it can’t take advantage of a write cache, and the real performance of each device is ~25 IOPS?
I am a bit concerned that again RAID-10 seems to perform worse than RAID-1. I think 16% will be beyond the bounds of testing error. The question is whether it is down to a flaw in my testing methodology. Looking at the raw fio outputs I am a bit puzzled why one HDD has much higher disk utilization values:
slow-raid1_randwrite: (g=0): rw=randwrite, bs=(R) 4096B-4096B, (W) 4096B-4096B, (T) 4096B-4096B, ioengine=libaio, iodepth=32
[…]
Disk stats (read/write):
    md6: ios=0/91688, merge=0/0, ticks=0/0, in_queue=0, util=0.00%, aggrios=0/91744, aggrmerge=0/497, aggrticks=0/44113055, aggrin_queue=4778486, aggrutil=14.52%
  sde: ios=0/91740, merge=0/502, ticks=0/7593320, in_queue=354720, util=1.31%
sdd: ios=0/91749, merge=0/493, ticks=0/80632791, in_queue=9202252, util=14.52% |
slow-raid10_randwrite: (groupid=0, jobs=4): err= 0: pid=23949: Mon May 27 14:32:34 2019
[…]
Disk stats (read/write):
    md7: ios=0/78691, merge=0/0, ticks=0/0, in_queue=0, util=0.00%, aggrios=0/78719, aggrmerge=0/506, aggrticks=0/43822275, aggrin_queue=5006454, aggrutil=15.52%
  sde: ios=0/78716, merge=0/510, ticks=0/6980884, in_queue=264756, util=1.18%
sdd: ios=0/78723, merge=0/503, ticks=0/80663667, in_queue=9748152, util=15.52% |
This actually does not happen in any of the other tests — only the random read tests — and it’s sdd both times. I don’t know if that is significant. Does it even matter as long as the disk is less than 100% utilized?
40%/60% read/write
This seems to be consistent with the random write results – RAID-10 doesn’t like random writes.
75%/25% read/write
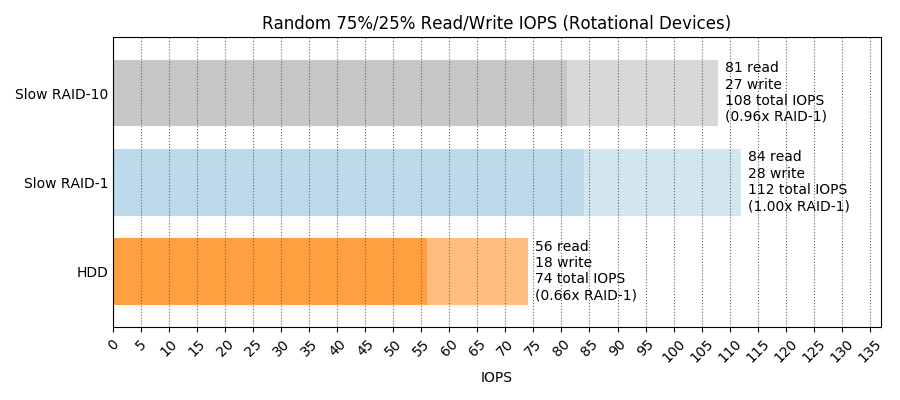
Again consistent with the random write and the 40/60 read/write test. Here there’s fewer writes, so the RAID-10 performance gap is smaller, but it’s there.
Data tables ^
If you’re not interested in tables of stuff that you already saw pretty pictures for, skip to a summary of my confusions.
Sequential IO ^
| Test | Throughput (MiB/s) | ||||||
|---|---|---|---|---|---|---|---|
| SSD | NVMe | HDD | Fast RAID-1 | Fast RAID-10 | Slow RAID-1 | Slow RAID-10 | |
| Read | 489 | 2,227 | 26 | 1,237 | 1,682 | 198 | 188 |
| Write | 447 | 1,754 | 20 | 321 | 321 | 18 | 19 |
Random IO ^
| Test | IOPS | |||||||
|---|---|---|---|---|---|---|---|---|
| SSD | NVMe | HDD | Fast RAID-1 | Fast RAID-10 | Slow RAID-1 | Slow RAID-10 | ||
| Random Read | 98,200 | 605,000 | 256 | 602,000 | 208,000 | 501 | 501 | |
| Random Write | 86,100 | 435,000 | 74 | 82,200 | 82,200 | 25 | 21 | |
| Random 40/60 Read/Write | Reads | 36,300 | 168,000 | 19 | 53,600 | 43,600 | 25 | 17 |
| Writes | 54,300 | 252,000 | 29 | 80,400 | 65,300 | 38 | 26 | |
| Random 75/25 Read/Write | Reads | 71,000 | 340,000 | 56 | 176,000 | 110,000 | 84 | 81 |
| Writes | 23,700 | 113,000 | 18 | 58,600 | 36,700 | 28 | 27 | |
Summary of open questions ^
Numbered for ease of clue-giving in the comments. Or on Twitter. I also made a post to the linux-raid mailing list. Even if you can’t figure out what I did wrong but have other tests you’d like to see me do, please let me know.
- Why is RAID-10 better at requesting sequential read IO from a faster device, such that in my tests it performed 1.36x faster than RAID-1?
- Why does a test of sequential read performance of HDDs achieve 28MiB/sec against a single HDD but over 7 times this for RAID? Is it because RAID uses readahead?
- When there is a huge disparity in device performance (e.g. 6x between SSD and NVMe), is it expected that RAID-1 is much better at using fast devices for read IO? Is there a reason why RAID-10 cannot do what RAID-1 does here?
Answer: Yes, and unknown, respectively. - What is wrong with my random read IO test against the HDDs? I should not be able to get 256 IOPS out of a single HDD. Can it possibly be disk cache, when disk cache is only 128MiB and over 3GiB was read randomly from the disk?
- Why does one of my HDDs show about 14% higher utilization than the other during random read tests?
- Why does RAID-10 appear to perform about 16% worse than RAID-1 for random writes against HDD devices?
Setup ^
Hardware ^
- Single Xeon W-2145 CPU @ 3.7GHz
- 256GiB memory
- 1x Samsung SM883 SATA SSD
- 1x Samsung PM983 NVMe
- 2x Seagate ST5000LM000 5.4kRPM SATA HDD
Operating system ^
- Debian buster
- linux-image-4.19.0-4-amd64 4.19.28-2
- mdadm – v4.1 – 2018-10-01
- No special tweaks
Storage ^
Partitioning ^
Each of the storage devices were given three 10GiB partitions. Example partition table:
$ sudo gdisk -l /dev/sdc GPT fdisk (gdisk) version 1.0.3 Partition table scan: MBR: protective BSD: not present APM: not present GPT: present Found valid GPT with protective MBR; using GPT. Disk /dev/sdc: 7501476528 sectors, 3.5 TiB Model: SAMSUNG MZ7KH3T8 Sector size (logical/physical): 512/4096 bytes Disk identifier (GUID): 7D7DFDA2-502C-47FE-A437-5442CCCE7E6B Partition table holds up to 128 entries Main partition table begins at sector 2 and ends at sector 33 First usable sector is 34, last usable sector is 7501476494 Partitions will be aligned on 2048-sector boundaries Total free space is 7438561901 sectors (3.5 TiB) Number Start (sector) End (sector) Size Code Name 1 2048 20973567 10.0 GiB 8300 Linux filesystem 2 20973568 41945087 10.0 GiB 8300 Linux filesystem 3 41945088 62916607 10.0 GiB 8300 Linux filesystem |
Partition usage:
- Raw device
- RAID-1 member
- RAID-10 member
RAID arrays ^
RAID devices were created as follows:
$ sudo mdadm --create \
    --verbose \
    --assume-clean /dev/md4 \
    --level=1 --raid-devices=2 --size=10G \
    /dev/nvme0n1p2 /dev/sdc2
$ sudo mdadm --create \
    --verbose \
    --assume-clean /dev/md5 \
    --level=10 --raid-devices=2 --size=10G \
    /dev/nvme0n1p3 /dev/sdc3
$ sudo mdadm --create \
    --verbose \
    --assume-clean /dev/md6 \
    --level=1 --raid-devices=2 --size=10G \
    /dev/sdd2 /dev/sde2
$ sudo mdadm --create \
    --verbose \
    --assume-clean /dev/md7 \
    --level=10 --raid-devices=2 --size=10G \
/dev/sdd3 /dev/sde3 |
Filesystems ^
In all cases an ext4 filesystem was created on the raw partitions and each of the RAID arrays as follows:
$ for dev in /dev/sdc1 /dev/nvme0n1p1 /dev/sdd1 /dev/md{4,5,6,7}; do \
    sudo mkfs.ext4 -E lazy_itable_init=0,lazy_journal_init=0 $dev; \
done |
Testing methodology ^
All testing was done with fio. Performance of both sequential throughput and random IO was tested.
Common parameters ^
- 4KiB IO size
- 4 jobs
- IO depth of 32
- libaio IO engine
- Direct IO (attempt to avoid Linux page cache)
- 8GiB data file
- 60 minute run time limit (flash devices finish their 4*8GiB workload much faster than this)
- gtod_reduce
Sequential throughput ^
Metric reported is average throughput (MiB per second).
- 100% read
- 100% write
Random IO ^
Metric reported is average IO operations per second (IOPS).
The 40/60 mix is representative of the production read/write mix on our production hosts.
- 100% read
- 100% write
- 40/60 read/write
- 75/25 read/write
Full fio script ^
#!/bin/bash set -eu fio=/opt/fio/bin/fio numjobs=4 iodepth=32 runtime=3600 targets=(ssd nvme hdd fast-raid1 fast-raid10 slow-raid1 slow-raid10) ts=$(date --utc +%FT%TZ) # seq read for target in "${targets[@]}"; do $fio --name="${target}_seqread" \ --filename="/mnt/${target}/fio" \ --ioengine=libaio \ --readwrite=read \ --direct=1 \ --numjobs=${numjobs} \ --bs=4k \ --iodepth=${iodepth} \ --size=8g \ --runtime=${runtime}s \ --gtod_reduce=1 \ --group_reporting | tee -a /home/andy/fio.${ts}.txt done # seq write for target in "${targets[@]}"; do $fio --name="${target}_seqwrite" \ --filename="/mnt/${target}/fio" \ --ioengine=libaio \ --readwrite=write \ --direct=1 \ --numjobs=${numjobs} \ --bs=4k \ --iodepth=${iodepth} \ --size=8g \ --runtime=${runtime}s \ --gtod_reduce=1 \ --group_reporting | tee -a /home/andy/fio.${ts}.txt done # random read for target in "${targets[@]}"; do $fio --name="${target}_randread" \ --filename="/mnt/${target}/fio" \ --ioengine=libaio \ --readwrite=randread \ --direct=1 \ --numjobs=${numjobs} \ --bs=4k \ --iodepth=${iodepth} \ --size=8g \ --runtime=${runtime}s \ --gtod_reduce=1 \ --group_reporting | tee -a /home/andy/fio.${ts}.txt done # random write for target in "${targets[@]}"; do $fio --name="${target}_randwrite" \ --filename="/mnt/${target}/fio" \ --ioengine=libaio \ --readwrite=randwrite \ --direct=1 \ --numjobs=${numjobs} \ --bs=4k \ --iodepth=${iodepth} \ --size=8g \ --runtime=${runtime}s \ --gtod_reduce=1 \ --group_reporting | tee -a /home/andy/fio.${ts}.txt done # 40/60 random read/write for target in "${targets[@]}"; do $fio --name="${target}_rand40read" \ --filename="/mnt/${target}/fio" \ --ioengine=libaio \ --readwrite=randrw \ --rwmixread=40 \ --direct=1 \ --numjobs=${numjobs} \ --bs=4k \ --iodepth=${iodepth} \ --size=8g \ --runtime=${runtime}s \ --gtod_reduce=1 \ --group_reporting | tee -a /home/andy/fio.${ts}.txt done # 75/25 random read/write for target in "${targets[@]}"; do $fio --name="${target}_rand75read" \ --filename="/mnt/${target}/fio" \ --ioengine=libaio \ --readwrite=randrw \ --rwmixread=75 \ --direct=1 \ --numjobs=${numjobs} \ --bs=4k \ --iodepth=${iodepth} \ --size=8g \ --runtime=${runtime}s \ --gtod_reduce=1 \ --group_reporting | tee -a /home/andy/fio.${ts}.txt done |
Full script output ^
This is massive and it’s also the last thing in this post, so stop reading now if you’re not interested in all the fio output.
ssd_seqread: (g=0): rw=read, bs=(R) 4096B-4096B, (W) 4096B-4096B, (T) 4096B-4096B, ioengine=libaio, iodepth=32
...
fio-3.13-42-g8066f
Starting 4 processes

ssd_seqread: (groupid=0, jobs=4): err= 0: pid=19203: Mon May 27 06:24:01 2019
  read: IOPS=125k, BW=489MiB/s (513MB/s)(32.0GiB/66986msec)
   bw (  KiB/s): min=498224, max=504592, per=100.00%, avg=501087.91, stdev=271.65, samples=532
   iops        : min=124556, max=126148, avg=125271.98, stdev=67.91, samples=532
  cpu          : usr=4.15%, sys=19.62%, ctx=1863599, majf=0, minf=162
  IO depths    : 1=0.1%, 2=0.1%, 4=0.1%, 8=0.1%, 16=0.1%, 32=100.0%, >=64=0.0%
     submit    : 0=0.0%, 4=100.0%, 8=0.0%, 16=0.0%, 32=0.0%, 64=0.0%, >=64=0.0%
     complete  : 0=0.0%, 4=100.0%, 8=0.0%, 16=0.0%, 32=0.1%, 64=0.0%, >=64=0.0%
     issued rwts: total=8388608,0,0,0 short=0,0,0,0 dropped=0,0,0,0
     latency   : target=0, window=0, percentile=100.00%, depth=32

Run status group 0 (all jobs):
   READ: bw=489MiB/s (513MB/s), 489MiB/s-489MiB/s (513MB/s-513MB/s), io=32.0GiB (34.4GB), run=66986-66986msec

Disk stats (read/write):
  sdc: ios=2251963/0, merge=6127068/0, ticks=2247864/0, in_queue=2133512, util=100.00%
nvme_seqread: (g=0): rw=read, bs=(R) 4096B-4096B, (W) 4096B-4096B, (T) 4096B-4096B, ioengine=libaio, iodepth=32
...
fio-3.13-42-g8066f
Starting 4 processes

nvme_seqread: (groupid=0, jobs=4): err= 0: pid=19240: Mon May 27 06:24:16 2019
  read: IOPS=570k, BW=2227MiB/s (2335MB/s)(32.0GiB/14715msec)
   bw (  MiB/s): min= 2196, max= 2245, per=100.00%, avg=2227.14, stdev= 2.69, samples=116
   iops        : min=562182, max=574866, avg=570147.93, stdev=687.78, samples=116
  cpu          : usr=11.69%, sys=38.24%, ctx=3450565, majf=0, minf=166
  IO depths    : 1=0.1%, 2=0.1%, 4=0.1%, 8=0.1%, 16=0.1%, 32=100.0%, >=64=0.0%
     submit    : 0=0.0%, 4=100.0%, 8=0.0%, 16=0.0%, 32=0.0%, 64=0.0%, >=64=0.0%
     complete  : 0=0.0%, 4=100.0%, 8=0.0%, 16=0.0%, 32=0.1%, 64=0.0%, >=64=0.0%
     issued rwts: total=8388608,0,0,0 short=0,0,0,0 dropped=0,0,0,0
     latency   : target=0, window=0, percentile=100.00%, depth=32

Run status group 0 (all jobs):
   READ: bw=2227MiB/s (2335MB/s), 2227MiB/s-2227MiB/s (2335MB/s-2335MB/s), io=32.0GiB (34.4GB), run=14715-14715msec

Disk stats (read/write):
  nvme0n1: ios=8350844/0, merge=0/0, ticks=1833161/0, in_queue=2068976, util=100.00%
hdd_seqread: (g=0): rw=read, bs=(R) 4096B-4096B, (W) 4096B-4096B, (T) 4096B-4096B, ioengine=libaio, iodepth=32
...
fio-3.13-42-g8066f
Starting 4 processes

hdd_seqread: (groupid=0, jobs=4): err= 0: pid=19265: Mon May 27 06:45:09 2019
  read: IOPS=6696, BW=26.2MiB/s (27.4MB/s)(32.0GiB/1252663msec)
   bw (  KiB/s): min=20832, max=29528, per=100.00%, avg=26785.12, stdev=195.38, samples=10020
   iops        : min= 5208, max= 7382, avg=6696.23, stdev=48.85, samples=10020
  cpu          : usr=0.77%, sys=2.53%, ctx=2237416, majf=0, minf=169
  IO depths    : 1=0.1%, 2=0.1%, 4=0.1%, 8=0.1%, 16=0.1%, 32=100.0%, >=64=0.0%
     submit    : 0=0.0%, 4=100.0%, 8=0.0%, 16=0.0%, 32=0.0%, 64=0.0%, >=64=0.0%
     complete  : 0=0.0%, 4=100.0%, 8=0.0%, 16=0.0%, 32=0.1%, 64=0.0%, >=64=0.0%
     issued rwts: total=8388608,0,0,0 short=0,0,0,0 dropped=0,0,0,0
     latency   : target=0, window=0, percentile=100.00%, depth=32

Run status group 0 (all jobs):
   READ: bw=26.2MiB/s (27.4MB/s), 26.2MiB/s-26.2MiB/s (27.4MB/s-27.4MB/s), io=32.0GiB (34.4GB), run=1252663-1252663msec

Disk stats (read/write):
  sdd: ios=2161877/0, merge=6188663/0, ticks=41221865/0, in_queue=40014352, util=99.87%
fast-raid1_seqread: (g=0): rw=read, bs=(R) 4096B-4096B, (W) 4096B-4096B, (T) 4096B-4096B, ioengine=libaio, iodepth=32
...
fio-3.13-42-g8066f
Starting 4 processes

fast-raid1_seqread: (groupid=0, jobs=4): err= 0: pid=19567: Mon May 27 06:45:36 2019
  read: IOPS=317k, BW=1237MiB/s (1298MB/s)(32.0GiB/26481msec)
   bw (  MiB/s): min= 1190, max= 1285, per=99.98%, avg=1237.17, stdev= 5.25, samples=208
   iops        : min=304852, max=328962, avg=316715.02, stdev=1345.21, samples=208
  cpu          : usr=6.59%, sys=39.68%, ctx=1439256, majf=0, minf=164
  IO depths    : 1=0.1%, 2=0.1%, 4=0.1%, 8=0.1%, 16=0.1%, 32=100.0%, >=64=0.0%
     submit    : 0=0.0%, 4=100.0%, 8=0.0%, 16=0.0%, 32=0.0%, 64=0.0%, >=64=0.0%
     complete  : 0=0.0%, 4=100.0%, 8=0.0%, 16=0.0%, 32=0.1%, 64=0.0%, >=64=0.0%
     issued rwts: total=8388608,0,0,0 short=0,0,0,0 dropped=0,0,0,0
     latency   : target=0, window=0, percentile=100.00%, depth=32

Run status group 0 (all jobs):
   READ: bw=1237MiB/s (1298MB/s), 1237MiB/s-1237MiB/s (1298MB/s-1298MB/s), io=32.0GiB (34.4GB), run=26481-26481msec

Disk stats (read/write):
    md4: ios=8360606/0, merge=0/0, ticks=0/0, in_queue=0, util=0.00%, aggrios=3539364/0, aggrmerge=654930/0, aggrticks=1150607/0, aggrin_queue=1162162, aggrutil=100.00%
  sdc: ios=1656610/0, merge=1309860/0, ticks=833468/0, in_queue=816236, util=99.51%
  nvme0n1: ios=5422119/0, merge=0/0, ticks=1467747/0, in_queue=1508088, util=100.00%
fast-raid10_seqread: (g=0): rw=read, bs=(R) 4096B-4096B, (W) 4096B-4096B, (T) 4096B-4096B, ioengine=libaio, iodepth=32
...
fio-3.13-42-g8066f
Starting 4 processes

fast-raid10_seqread: (groupid=0, jobs=4): err= 0: pid=19596: Mon May 27 06:45:56 2019
  read: IOPS=431k, BW=1682MiB/s (1763MB/s)(32.0GiB/19485msec)
   bw (  MiB/s): min= 1660, max= 5369, per=100.00%, avg=2840.84, stdev=450.11, samples=107
   iops        : min=425100, max=1374556, avg=727254.32, stdev=115227.08, samples=107
  cpu          : usr=10.61%, sys=46.21%, ctx=956991, majf=0, minf=169
  IO depths    : 1=0.1%, 2=0.1%, 4=0.1%, 8=0.1%, 16=0.1%, 32=100.0%, >=64=0.0%
     submit    : 0=0.0%, 4=100.0%, 8=0.0%, 16=0.0%, 32=0.0%, 64=0.0%, >=64=0.0%
     complete  : 0=0.0%, 4=100.0%, 8=0.0%, 16=0.0%, 32=0.1%, 64=0.0%, >=64=0.0%
     issued rwts: total=8388608,0,0,0 short=0,0,0,0 dropped=0,0,0,0
     latency   : target=0, window=0, percentile=100.00%, depth=32

Run status group 0 (all jobs):
   READ: bw=1682MiB/s (1763MB/s), 1682MiB/s-1682MiB/s (1763MB/s-1763MB/s), io=32.0GiB (34.4GB), run=19485-19485msec

Disk stats (read/write):
    md5: ios=8354245/3, merge=0/0, ticks=0/0, in_queue=0, util=0.00%, aggrios=3785476/4, aggrmerge=408786/1, aggrticks=295278/4, aggrin_queue=288072, aggrutil=99.82%
  nvme0n1: ios=6479930/4, merge=0/1, ticks=46423/0, in_queue=46280, util=99.82%
  sdc: ios=1091022/5, merge=817572/1, ticks=544134/8, in_queue=529864, util=98.78%
slow-raid1_seqread: (g=0): rw=read, bs=(R) 4096B-4096B, (W) 4096B-4096B, (T) 4096B-4096B, ioengine=libaio, iodepth=32
...
fio-3.13-42-g8066f
Starting 4 processes

slow-raid1_seqread: (groupid=0, jobs=4): err= 0: pid=19623: Mon May 27 06:48:42 2019
  read: IOPS=50.8k, BW=198MiB/s (208MB/s)(32.0GiB/165096msec)
   bw (  KiB/s): min=120944, max=589128, per=100.00%, avg=312508.47, stdev=59646.40, samples=1011
   iops        : min=30236, max=147282, avg=78127.09, stdev=14911.62, samples=1011
  cpu          : usr=2.68%, sys=17.62%, ctx=7840715, majf=0, minf=170
  IO depths    : 1=0.1%, 2=0.1%, 4=0.1%, 8=0.1%, 16=0.1%, 32=100.0%, >=64=0.0%
     submit    : 0=0.0%, 4=100.0%, 8=0.0%, 16=0.0%, 32=0.0%, 64=0.0%, >=64=0.0%
     complete  : 0=0.0%, 4=100.0%, 8=0.0%, 16=0.0%, 32=0.1%, 64=0.0%, >=64=0.0%
     issued rwts: total=8388608,0,0,0 short=0,0,0,0 dropped=0,0,0,0
     latency   : target=0, window=0, percentile=100.00%, depth=32

Run status group 0 (all jobs):
   READ: bw=198MiB/s (208MB/s), 198MiB/s-198MiB/s (208MB/s-208MB/s), io=32.0GiB (34.4GB), run=165096-165096msec

Disk stats (read/write):
    md6: ios=8375702/4, merge=0/0, ticks=0/0, in_queue=0, util=0.00%, aggrios=3942792/8, aggrmerge=246472/1, aggrticks=5293402/364, aggrin_queue=5228076, aggrutil=99.83%
  sde: ios=5761197/8, merge=59878/1, ticks=5227721/336, in_queue=5207544, util=99.76%
  sdd: ios=2124388/8, merge=433067/1, ticks=5359084/392, in_queue=5248608, util=99.83%
slow-raid10_seqread: (g=0): rw=read, bs=(R) 4096B-4096B, (W) 4096B-4096B, (T) 4096B-4096B, ioengine=libaio, iodepth=32
...
fio-3.13-42-g8066f
Starting 4 processes

slow-raid10_seqread: (groupid=0, jobs=4): err= 0: pid=19672: Mon May 27 06:51:37 2019
  read: IOPS=48.1k, BW=188MiB/s (197MB/s)(32.0GiB/174318msec)
   bw (  KiB/s): min=117760, max=588752, per=100.00%, avg=285330.33, stdev=49931.94, samples=1052
   iops        : min=29440, max=147188, avg=71332.29, stdev=12482.89, samples=1052
  cpu          : usr=2.65%, sys=16.99%, ctx=7903054, majf=0, minf=162
  IO depths    : 1=0.1%, 2=0.1%, 4=0.1%, 8=0.1%, 16=0.1%, 32=100.0%, >=64=0.0%
     submit    : 0=0.0%, 4=100.0%, 8=0.0%, 16=0.0%, 32=0.0%, 64=0.0%, >=64=0.0%
     complete  : 0=0.0%, 4=100.0%, 8=0.0%, 16=0.0%, 32=0.1%, 64=0.0%, >=64=0.0%
     issued rwts: total=8388608,0,0,0 short=0,0,0,0 dropped=0,0,0,0
     latency   : target=0, window=0, percentile=100.00%, depth=32

Run status group 0 (all jobs):
   READ: bw=188MiB/s (197MB/s), 188MiB/s-188MiB/s (197MB/s-197MB/s), io=32.0GiB (34.4GB), run=174318-174318msec

Disk stats (read/write):
    md7: ios=8382423/4, merge=0/0, ticks=0/0, in_queue=0, util=0.00%, aggrios=3990234/8, aggrmerge=203371/1, aggrticks=5499680/371, aggrin_queue=5432004, aggrutil=99.83%
  sde: ios=5773992/8, merge=11192/1, ticks=5402117/359, in_queue=5381584, util=99.79%
  sdd: ios=2206477/8, merge=395550/1, ticks=5597244/383, in_queue=5482424, util=99.83%
ssd_seqwrite: (g=0): rw=write, bs=(R) 4096B-4096B, (W) 4096B-4096B, (T) 4096B-4096B, ioengine=libaio, iodepth=32
...
fio-3.13-42-g8066f
Starting 4 processes

ssd_seqwrite: (groupid=0, jobs=4): err= 0: pid=19725: Mon May 27 06:52:51 2019
  write: IOPS=115k, BW=447MiB/s (469MB/s)(32.0GiB/73261msec); 0 zone resets
   bw (  KiB/s): min=421064, max=463912, per=100.00%, avg=458109.77, stdev=2065.39, samples=584
   iops        : min=105266, max=115978, avg=114527.41, stdev=516.35, samples=584
  cpu          : usr=3.48%, sys=21.52%, ctx=2277712, majf=0, minf=37
  IO depths    : 1=0.1%, 2=0.1%, 4=0.1%, 8=0.1%, 16=0.1%, 32=100.0%, >=64=0.0%
     submit    : 0=0.0%, 4=100.0%, 8=0.0%, 16=0.0%, 32=0.0%, 64=0.0%, >=64=0.0%
     complete  : 0=0.0%, 4=100.0%, 8=0.0%, 16=0.0%, 32=0.1%, 64=0.0%, >=64=0.0%
     issued rwts: total=0,8388608,0,0 short=0,0,0,0 dropped=0,0,0,0
     latency   : target=0, window=0, percentile=100.00%, depth=32

Run status group 0 (all jobs):
  WRITE: bw=447MiB/s (469MB/s), 447MiB/s-447MiB/s (469MB/s-469MB/s), io=32.0GiB (34.4GB), run=73261-73261msec

Disk stats (read/write):
  sdc: ios=0/2238107, merge=0/6047456, ticks=0/2478437, in_queue=2335432, util=99.96%
nvme_seqwrite: (g=0): rw=write, bs=(R) 4096B-4096B, (W) 4096B-4096B, (T) 4096B-4096B, ioengine=libaio, iodepth=32
...
fio-3.13-42-g8066f
Starting 4 processes

nvme_seqwrite: (groupid=0, jobs=4): err= 0: pid=19758: Mon May 27 06:53:10 2019
  write: IOPS=449k, BW=1754MiB/s (1839MB/s)(32.0GiB/18681msec); 0 zone resets
   bw (  MiB/s): min= 1623, max= 1857, per=99.98%, avg=1753.65, stdev=17.41, samples=148
   iops        : min=415654, max=475538, avg=448934.59, stdev=4456.41, samples=148
  cpu          : usr=8.61%, sys=56.50%, ctx=1664510, majf=0, minf=42
  IO depths    : 1=0.1%, 2=0.1%, 4=0.1%, 8=0.1%, 16=0.1%, 32=100.0%, >=64=0.0%
     submit    : 0=0.0%, 4=100.0%, 8=0.0%, 16=0.0%, 32=0.0%, 64=0.0%, >=64=0.0%
     complete  : 0=0.0%, 4=100.0%, 8=0.0%, 16=0.0%, 32=0.1%, 64=0.0%, >=64=0.0%
     issued rwts: total=0,8388608,0,0 short=0,0,0,0 dropped=0,0,0,0
     latency   : target=0, window=0, percentile=100.00%, depth=32

Run status group 0 (all jobs):
  WRITE: bw=1754MiB/s (1839MB/s), 1754MiB/s-1754MiB/s (1839MB/s-1839MB/s), io=32.0GiB (34.4GB), run=18681-18681msec

Disk stats (read/write):
  nvme0n1: ios=0/8373430, merge=0/3, ticks=0/2210464, in_queue=2410804, util=100.00%
hdd_seqwrite: (g=0): rw=write, bs=(R) 4096B-4096B, (W) 4096B-4096B, (T) 4096B-4096B, ioengine=libaio, iodepth=32
...
fio-3.13-42-g8066f
Starting 4 processes

hdd_seqwrite: (groupid=0, jobs=4): err= 0: pid=19786: Mon May 27 07:20:26 2019
  write: IOPS=5129, BW=20.0MiB/s (21.0MB/s)(32.0GiB/1635487msec); 0 zone resets
   bw (  KiB/s): min= 1344, max=49824, per=100.00%, avg=20526.55, stdev=2973.47, samples=13072
   iops        : min=  336, max=12456, avg=5131.58, stdev=743.37, samples=13072
  cpu          : usr=0.45%, sys=1.73%, ctx=2138826, majf=0, minf=34
  IO depths    : 1=0.1%, 2=0.1%, 4=0.1%, 8=0.1%, 16=0.1%, 32=100.0%, >=64=0.0%
     submit    : 0=0.0%, 4=100.0%, 8=0.0%, 16=0.0%, 32=0.0%, 64=0.0%, >=64=0.0%
     complete  : 0=0.0%, 4=100.0%, 8=0.0%, 16=0.0%, 32=0.1%, 64=0.0%, >=64=0.0%
     issued rwts: total=0,8388608,0,0 short=0,0,0,0 dropped=0,0,0,0
     latency   : target=0, window=0, percentile=100.00%, depth=32

Run status group 0 (all jobs):
  WRITE: bw=20.0MiB/s (21.0MB/s), 20.0MiB/s-20.0MiB/s (21.0MB/s-21.0MB/s), io=32.0GiB (34.4GB), run=1635487-1635487msec

Disk stats (read/write):
  sdd: ios=0/2151560, merge=0/6224246, ticks=0/51570499, in_queue=49570692, util=96.59%
fast-raid1_seqwrite: (g=0): rw=write, bs=(R) 4096B-4096B, (W) 4096B-4096B, (T) 4096B-4096B, ioengine=libaio, iodepth=32
...
fio-3.13-42-g8066f
Starting 4 processes

fast-raid1_seqwrite: (groupid=0, jobs=4): err= 0: pid=20133: Mon May 27 07:22:08 2019
  write: IOPS=82.2k, BW=321MiB/s (337MB/s)(32.0GiB/102043msec); 0 zone resets
   bw (  KiB/s): min=309848, max=386576, per=100.00%, avg=329052.54, stdev=1516.96, samples=814
   iops        : min=77462, max=96644, avg=82263.12, stdev=379.24, samples=814
  cpu          : usr=2.33%, sys=35.15%, ctx=966557, majf=0, minf=39
  IO depths    : 1=0.1%, 2=0.1%, 4=0.1%, 8=0.1%, 16=0.1%, 32=100.0%, >=64=0.0%
     submit    : 0=0.0%, 4=100.0%, 8=0.0%, 16=0.0%, 32=0.0%, 64=0.0%, >=64=0.0%
     complete  : 0=0.0%, 4=100.0%, 8=0.0%, 16=0.0%, 32=0.1%, 64=0.0%, >=64=0.0%
     issued rwts: total=0,8388608,0,0 short=0,0,0,0 dropped=0,0,0,0
     latency   : target=0, window=0, percentile=100.00%, depth=32

Run status group 0 (all jobs):
  WRITE: bw=321MiB/s (337MB/s), 321MiB/s-321MiB/s (337MB/s-337MB/s), io=32.0GiB (34.4GB), run=102043-102043msec

Disk stats (read/write):
    md4: ios=0/8376455, merge=0/0, ticks=0/0, in_queue=0, util=0.00%, aggrios=0/8388458, aggrmerge=0/212, aggrticks=0/705526, aggrin_queue=734298, aggrutil=100.00%
  sdc: ios=0/8388268, merge=0/404, ticks=0/1288060, in_queue=1246864, util=98.49%
  nvme0n1: ios=0/8388649, merge=0/20, ticks=0/122992, in_queue=221732, util=100.00%
fast-raid10_seqwrite: (g=0): rw=write, bs=(R) 4096B-4096B, (W) 4096B-4096B, (T) 4096B-4096B, ioengine=libaio, iodepth=32
...
fio-3.13-42-g8066f
Starting 4 processes

fast-raid10_seqwrite: (groupid=0, jobs=4): err= 0: pid=20182: Mon May 27 07:23:51 2019
  write: IOPS=82.2k, BW=321MiB/s (337MB/s)(32.0GiB/101991msec); 0 zone resets
   bw (  KiB/s): min=319408, max=337072, per=99.99%, avg=328965.56, stdev=638.35, samples=812
   iops        : min=79852, max=84268, avg=82241.37, stdev=159.58, samples=812
  cpu          : usr=1.98%, sys=35.58%, ctx=965045, majf=0, minf=34
  IO depths    : 1=0.1%, 2=0.1%, 4=0.1%, 8=0.1%, 16=0.1%, 32=100.0%, >=64=0.0%
     submit    : 0=0.0%, 4=100.0%, 8=0.0%, 16=0.0%, 32=0.0%, 64=0.0%, >=64=0.0%
     complete  : 0=0.0%, 4=100.0%, 8=0.0%, 16=0.0%, 32=0.1%, 64=0.0%, >=64=0.0%
     issued rwts: total=0,8388608,0,0 short=0,0,0,0 dropped=0,0,0,0
     latency   : target=0, window=0, percentile=100.00%, depth=32

Run status group 0 (all jobs):
  WRITE: bw=321MiB/s (337MB/s), 321MiB/s-321MiB/s (337MB/s-337MB/s), io=32.0GiB (34.4GB), run=101991-101991msec

Disk stats (read/write):
    md5: ios=0/8380185, merge=0/0, ticks=0/0, in_queue=0, util=0.00%, aggrios=0/8388294, aggrmerge=0/387, aggrticks=0/703466, aggrin_queue=733542, aggrutil=100.00%
  nvme0n1: ios=0/8388656, merge=0/21, ticks=0/121330, in_queue=218748, util=100.00%
  sdc: ios=0/8387932, merge=0/753, ticks=0/1285603, in_queue=1248336, util=98.56%
slow-raid1_seqwrite: (g=0): rw=write, bs=(R) 4096B-4096B, (W) 4096B-4096B, (T) 4096B-4096B, ioengine=libaio, iodepth=32
...
fio-3.13-42-g8066f
Starting 4 processes

slow-raid1_seqwrite: (groupid=0, jobs=4): err= 0: pid=20227: Mon May 27 07:54:46 2019
  write: IOPS=4524, BW=17.7MiB/s (18.5MB/s)(32.0GiB/1854193msec); 0 zone resets
   bw (  KiB/s): min= 1023, max=109266, per=100.00%, avg=18383.76, stdev=4036.11, samples=14568
   iops        : min=  255, max=27315, avg=4595.85, stdev=1009.02, samples=14568
  cpu          : usr=0.35%, sys=3.25%, ctx=1507462, majf=0, minf=39
  IO depths    : 1=0.1%, 2=0.1%, 4=0.1%, 8=0.1%, 16=0.1%, 32=100.0%, >=64=0.0%
     submit    : 0=0.0%, 4=100.0%, 8=0.0%, 16=0.0%, 32=0.0%, 64=0.0%, >=64=0.0%
     complete  : 0=0.0%, 4=100.0%, 8=0.0%, 16=0.0%, 32=0.1%, 64=0.0%, >=64=0.0%
     issued rwts: total=0,8388608,0,0 short=0,0,0,0 dropped=0,0,0,0
     latency   : target=0, window=0, percentile=100.00%, depth=32

Run status group 0 (all jobs):
  WRITE: bw=17.7MiB/s (18.5MB/s), 17.7MiB/s-17.7MiB/s (18.5MB/s-18.5MB/s), io=32.0GiB (34.4GB), run=1854193-1854193msec

Disk stats (read/write):
    md6: ios=0/8387542, merge=0/0, ticks=0/0, in_queue=0, util=0.00%, aggrios=0/8301184, aggrmerge=0/88878, aggrticks=0/22516755, aggrin_queue=21684290, aggrutil=82.90%
  sde: ios=0/8300886, merge=0/89177, ticks=0/22832315, in_queue=21922472, util=82.90%
  sdd: ios=0/8301483, merge=0/88580, ticks=0/22201195, in_queue=21446108, util=81.09%
slow-raid10_seqwrite: (g=0): rw=write, bs=(R) 4096B-4096B, (W) 4096B-4096B, (T) 4096B-4096B, ioengine=libaio, iodepth=32
...
fio-3.13-42-g8066f
Starting 4 processes

slow-raid10_seqwrite: (groupid=0, jobs=4): err= 0: pid=20632: Mon May 27 08:24:04 2019
  write: IOPS=4771, BW=18.6MiB/s (19.5MB/s)(32.0GiB/1758142msec); 0 zone resets
   bw (  KiB/s): min=  304, max=123886, per=100.00%, avg=19558.79, stdev=4101.05, samples=13715
   iops        : min=   76, max=30970, avg=4889.57, stdev=1025.26, samples=13715
  cpu          : usr=0.39%, sys=3.58%, ctx=1502000, majf=0, minf=37
  IO depths    : 1=0.1%, 2=0.1%, 4=0.1%, 8=0.1%, 16=0.1%, 32=100.0%, >=64=0.0%
     submit    : 0=0.0%, 4=100.0%, 8=0.0%, 16=0.0%, 32=0.0%, 64=0.0%, >=64=0.0%
     complete  : 0=0.0%, 4=100.0%, 8=0.0%, 16=0.0%, 32=0.1%, 64=0.0%, >=64=0.0%
     issued rwts: total=0,8388608,0,0 short=0,0,0,0 dropped=0,0,0,0
     latency   : target=0, window=0, percentile=100.00%, depth=32

Run status group 0 (all jobs):
  WRITE: bw=18.6MiB/s (19.5MB/s), 18.6MiB/s-18.6MiB/s (19.5MB/s-19.5MB/s), io=32.0GiB (34.4GB), run=1758142-1758142msec

Disk stats (read/write):
    md7: ios=0/8388379, merge=0/0, ticks=0/0, in_queue=0, util=0.00%, aggrios=0/8305307, aggrmerge=0/84633, aggrticks=0/21623815, aggrin_queue=20873796, aggrutil=83.10%
  sde: ios=0/8304761, merge=0/85177, ticks=0/21726870, in_queue=20963144, util=83.10%
  sdd: ios=0/8305853, merge=0/84090, ticks=0/21520760, in_queue=20784448, util=82.48%
ssd_randread: (g=0): rw=randread, bs=(R) 4096B-4096B, (W) 4096B-4096B, (T) 4096B-4096B, ioengine=libaio, iodepth=32
...
fio-3.13-42-g8066f
Starting 4 processes

ssd_randread: (groupid=0, jobs=4): err= 0: pid=20854: Mon May 27 08:25:30 2019
  read: IOPS=98.2k, BW=384MiB/s (402MB/s)(32.0GiB/85444msec)
   bw (  KiB/s): min=302856, max=438967, per=99.99%, avg=392684.85, stdev=6920.97, samples=679
   iops        : min=75714, max=109741, avg=98171.13, stdev=1730.24, samples=679
  cpu          : usr=2.96%, sys=16.22%, ctx=1756277, majf=0, minf=160
  IO depths    : 1=0.1%, 2=0.1%, 4=0.1%, 8=0.1%, 16=0.1%, 32=100.0%, >=64=0.0%
     submit    : 0=0.0%, 4=100.0%, 8=0.0%, 16=0.0%, 32=0.0%, 64=0.0%, >=64=0.0%
     complete  : 0=0.0%, 4=100.0%, 8=0.0%, 16=0.0%, 32=0.1%, 64=0.0%, >=64=0.0%
     issued rwts: total=8388608,0,0,0 short=0,0,0,0 dropped=0,0,0,0
     latency   : target=0, window=0, percentile=100.00%, depth=32

Run status group 0 (all jobs):
   READ: bw=384MiB/s (402MB/s), 384MiB/s-384MiB/s (402MB/s-402MB/s), io=32.0GiB (34.4GB), run=85444-85444msec

Disk stats (read/write):
  sdc: ios=8375680/3, merge=7760/1, ticks=5232536/4, in_queue=2740752, util=100.00%
nvme_randread: (g=0): rw=randread, bs=(R) 4096B-4096B, (W) 4096B-4096B, (T) 4096B-4096B, ioengine=libaio, iodepth=32
...
fio-3.13-42-g8066f
Starting 4 processes

nvme_randread: (groupid=0, jobs=4): err= 0: pid=20883: Mon May 27 08:25:45 2019
  read: IOPS=605k, BW=2365MiB/s (2480MB/s)(32.0GiB/13855msec)
   bw (  MiB/s): min= 2348, max= 2378, per=100.00%, avg=2365.18, stdev= 1.83, samples=108
   iops        : min=601230, max=608820, avg=605485.41, stdev=468.52, samples=108
  cpu          : usr=12.96%, sys=38.88%, ctx=3673729, majf=0, minf=159
  IO depths    : 1=0.1%, 2=0.1%, 4=0.1%, 8=0.1%, 16=0.1%, 32=100.0%, >=64=0.0%
     submit    : 0=0.0%, 4=100.0%, 8=0.0%, 16=0.0%, 32=0.0%, 64=0.0%, >=64=0.0%
     complete  : 0=0.0%, 4=100.0%, 8=0.0%, 16=0.0%, 32=0.1%, 64=0.0%, >=64=0.0%
     issued rwts: total=8388608,0,0,0 short=0,0,0,0 dropped=0,0,0,0
     latency   : target=0, window=0, percentile=100.00%, depth=32

Run status group 0 (all jobs):
   READ: bw=2365MiB/s (2480MB/s), 2365MiB/s-2365MiB/s (2480MB/s-2480MB/s), io=32.0GiB (34.4GB), run=13855-13855msec

Disk stats (read/write):
  nvme0n1: ios=8263387/2, merge=0/1, ticks=1708222/0, in_queue=1893928, util=100.00%
hdd_randread: (g=0): rw=randread, bs=(R) 4096B-4096B, (W) 4096B-4096B, (T) 4096B-4096B, ioengine=libaio, iodepth=32
...
fio-3.13-42-g8066f
Starting 4 processes

hdd_randread: (groupid=0, jobs=4): err= 0: pid=20908: Mon May 27 09:25:46 2019
  read: IOPS=256, BW=1025KiB/s (1049kB/s)(3603MiB/3600861msec)
   bw (  KiB/s): min=  278, max= 1640, per=100.00%, avg=1024.35, stdev=30.58, samples=28804
   iops        : min=   68, max=  410, avg=255.94, stdev= 7.65, samples=28804
  cpu          : usr=0.02%, sys=0.07%, ctx=115716, majf=0, minf=163
  IO depths    : 1=0.1%, 2=0.1%, 4=0.1%, 8=0.1%, 16=0.1%, 32=100.0%, >=64=0.0%
     submit    : 0=0.0%, 4=100.0%, 8=0.0%, 16=0.0%, 32=0.0%, 64=0.0%, >=64=0.0%
     complete  : 0=0.0%, 4=100.0%, 8=0.0%, 16=0.0%, 32=0.1%, 64=0.0%, >=64=0.0%
     issued rwts: total=922360,0,0,0 short=0,0,0,0 dropped=0,0,0,0
     latency   : target=0, window=0, percentile=100.00%, depth=32

Run status group 0 (all jobs):
   READ: bw=1025KiB/s (1049kB/s), 1025KiB/s-1025KiB/s (1049kB/s-1049kB/s), io=3603MiB (3778MB), run=3600861-3600861msec

Disk stats (read/write):
  sdd: ios=922292/3, merge=27/1, ticks=217720971/727, in_queue=113860764, util=98.94%
fast-raid1_randread: (g=0): rw=randread, bs=(R) 4096B-4096B, (W) 4096B-4096B, (T) 4096B-4096B, ioengine=libaio, iodepth=32
...
fio-3.13-42-g8066f
Starting 4 processes

fast-raid1_randread: (groupid=0, jobs=4): err= 0: pid=21466: Mon May 27 09:26:00 2019
  read: IOPS=602k, BW=2350MiB/s (2465MB/s)(32.0GiB/13941msec)
   bw (  MiB/s): min= 2220, max= 2415, per=100.00%, avg=2354.09, stdev= 9.81, samples=108
   iops        : min=568374, max=618476, avg=602648.11, stdev=2510.22, samples=108
  cpu          : usr=10.93%, sys=52.28%, ctx=2925303, majf=0, minf=167
  IO depths    : 1=0.1%, 2=0.1%, 4=0.1%, 8=0.1%, 16=0.1%, 32=100.0%, >=64=0.0%
     submit    : 0=0.0%, 4=100.0%, 8=0.0%, 16=0.0%, 32=0.0%, 64=0.0%, >=64=0.0%
     complete  : 0=0.0%, 4=100.0%, 8=0.0%, 16=0.0%, 32=0.1%, 64=0.0%, >=64=0.0%
     issued rwts: total=8388608,0,0,0 short=0,0,0,0 dropped=0,0,0,0
     latency   : target=0, window=0, percentile=100.00%, depth=32

Run status group 0 (all jobs):
   READ: bw=2350MiB/s (2465MB/s), 2350MiB/s-2350MiB/s (2465MB/s-2465MB/s), io=32.0GiB (34.4GB), run=13941-13941msec

Disk stats (read/write):
    md4: ios=8369135/3, merge=0/0, ticks=0/0, in_queue=0, util=0.00%, aggrios=4193950/4, aggrmerge=354/1, aggrticks=857898/2, aggrin_queue=664428, aggrutil=100.00%
  sdc: ios=1367376/5, merge=708/1, ticks=868311/5, in_queue=446108, util=98.96%
  nvme0n1: ios=7020524/4, merge=0/1, ticks=847486/0, in_queue=882748, util=100.00%
fast-raid10_randread: (g=0): rw=randread, bs=(R) 4096B-4096B, (W) 4096B-4096B, (T) 4096B-4096B, ioengine=libaio, iodepth=32
...
fio-3.13-42-g8066f
Starting 4 processes

fast-raid10_randread: (groupid=0, jobs=4): err= 0: pid=21493: Mon May 27 09:26:41 2019
  read: IOPS=208k, BW=811MiB/s (850MB/s)(32.0GiB/40423msec)
   bw (  KiB/s): min=780328, max=899160, per=100.00%, avg=831072.62, stdev=6858.67, samples=319
   iops        : min=195082, max=224790, avg=207768.08, stdev=1714.67, samples=319
  cpu          : usr=4.65%, sys=25.53%, ctx=898971, majf=0, minf=166
  IO depths    : 1=0.1%, 2=0.1%, 4=0.1%, 8=0.1%, 16=0.1%, 32=100.0%, >=64=0.0%
     submit    : 0=0.0%, 4=100.0%, 8=0.0%, 16=0.0%, 32=0.0%, 64=0.0%, >=64=0.0%
     complete  : 0=0.0%, 4=100.0%, 8=0.0%, 16=0.0%, 32=0.1%, 64=0.0%, >=64=0.0%
     issued rwts: total=8388608,0,0,0 short=0,0,0,0 dropped=0,0,0,0
     latency   : target=0, window=0, percentile=100.00%, depth=32

Run status group 0 (all jobs):
   READ: bw=811MiB/s (850MB/s), 811MiB/s-811MiB/s (850MB/s-850MB/s), io=32.0GiB (34.4GB), run=40423-40423msec

Disk stats (read/write):
    md5: ios=8382356/4, merge=0/0, ticks=0/0, in_queue=0, util=0.00%, aggrios=4192380/10, aggrmerge=1919/1, aggrticks=1400439/5, aggrin_queue=827536, aggrutil=100.00%
  nvme0n1: ios=4420890/10, merge=0/1, ticks=340926/1, in_queue=362248, util=100.00%
  sdc: ios=3963871/11, merge=3838/1, ticks=2459952/9, in_queue=1292824, util=99.82%
slow-raid1_randread: (g=0): rw=randread, bs=(R) 4096B-4096B, (W) 4096B-4096B, (T) 4096B-4096B, ioengine=libaio, iodepth=32
...
fio-3.13-42-g8066f
Starting 4 processes

slow-raid1_randread: (groupid=0, jobs=4): err= 0: pid=21520: Mon May 27 10:26:42 2019
  read: IOPS=501, BW=2007KiB/s (2055kB/s)(7057MiB/3600598msec)
   bw (  KiB/s): min=  471, max= 3608, per=99.96%, avg=2006.11, stdev=90.14, samples=28804
   iops        : min=  117, max=  902, avg=501.18, stdev=22.55, samples=28804
  cpu          : usr=0.11%, sys=0.43%, ctx=976930, majf=0, minf=162
  IO depths    : 1=0.1%, 2=0.1%, 4=0.1%, 8=0.1%, 16=0.1%, 32=100.0%, >=64=0.0%
     submit    : 0=0.0%, 4=100.0%, 8=0.0%, 16=0.0%, 32=0.0%, 64=0.0%, >=64=0.0%
     complete  : 0=0.0%, 4=100.0%, 8=0.0%, 16=0.0%, 32=0.1%, 64=0.0%, >=64=0.0%
     issued rwts: total=1806648,0,0,0 short=0,0,0,0 dropped=0,0,0,0
     latency   : target=0, window=0, percentile=100.00%, depth=32

Run status group 0 (all jobs):
   READ: bw=2007KiB/s (2055kB/s), 2007KiB/s-2007KiB/s (2055kB/s-2055kB/s), io=7057MiB (7400MB), run=3600598-3600598msec

Disk stats (read/write):
    md6: ios=1806648/4, merge=0/0, ticks=0/0, in_queue=0, util=0.00%, aggrios=903297/8, aggrmerge=26/1, aggrticks=191804907/2091, aggrin_queue=110917908, aggrutil=99.11%
  sde: ios=902689/8, merge=27/1, ticks=192629122/2126, in_queue=110974004, util=99.11%
  sdd: ios=903905/8, merge=26/1, ticks=190980693/2057, in_queue=110861812, util=99.07%
slow-raid10_randread: (g=0): rw=randread, bs=(R) 4096B-4096B, (W) 4096B-4096B, (T) 4096B-4096B, ioengine=libaio, iodepth=32
...
fio-3.13-42-g8066f
Starting 4 processes

slow-raid10_randread: (groupid=0, jobs=4): err= 0: pid=22141: Mon May 27 11:26:43 2019
  read: IOPS=501, BW=2004KiB/s (2052kB/s)(7047MiB/3600530msec)
   bw (  KiB/s): min=  568, max= 3616, per=99.95%, avg=2002.99, stdev=89.26, samples=28801
   iops        : min=  142, max=  904, avg=500.27, stdev=22.34, samples=28801
  cpu          : usr=0.11%, sys=0.43%, ctx=981766, majf=0, minf=158
  IO depths    : 1=0.1%, 2=0.1%, 4=0.1%, 8=0.1%, 16=0.1%, 32=100.0%, >=64=0.0%
     submit    : 0=0.0%, 4=100.0%, 8=0.0%, 16=0.0%, 32=0.0%, 64=0.0%, >=64=0.0%
     complete  : 0=0.0%, 4=100.0%, 8=0.0%, 16=0.0%, 32=0.1%, 64=0.0%, >=64=0.0%
     issued rwts: total=1804024,0,0,0 short=0,0,0,0 dropped=0,0,0,0
     latency   : target=0, window=0, percentile=100.00%, depth=32

Run status group 0 (all jobs):
   READ: bw=2004KiB/s (2052kB/s), 2004KiB/s-2004KiB/s (2052kB/s-2052kB/s), io=7047MiB (7389MB), run=3600530-3600530msec

Disk stats (read/write):
    md7: ios=1804024/4, merge=0/0, ticks=0/0, in_queue=0, util=0.00%, aggrios=901984/8, aggrmerge=27/1, aggrticks=192431115/2129, aggrin_queue=111173106, aggrutil=99.17%
  sde: ios=904766/8, merge=24/1, ticks=190098507/2111, in_queue=110754216, util=99.17%
  sdd: ios=899203/8, merge=30/1, ticks=194763724/2148, in_queue=111591996, util=99.17%
ssd_randwrite: (g=0): rw=randwrite, bs=(R) 4096B-4096B, (W) 4096B-4096B, (T) 4096B-4096B, ioengine=libaio, iodepth=32
...
fio-3.13-42-g8066f
Starting 4 processes

ssd_randwrite: (groupid=0, jobs=4): err= 0: pid=22733: Mon May 27 11:28:21 2019
  write: IOPS=86.1k, BW=336MiB/s (353MB/s)(32.0GiB/97467msec); 0 zone resets
   bw (  KiB/s): min=317728, max=381816, per=100.00%, avg=344273.34, stdev=2458.01, samples=775
   iops        : min=79432, max=95454, avg=86068.26, stdev=614.50, samples=775
  cpu          : usr=2.91%, sys=26.62%, ctx=8245010, majf=0, minf=37
  IO depths    : 1=0.1%, 2=0.1%, 4=0.1%, 8=0.1%, 16=0.1%, 32=100.0%, >=64=0.0%
     submit    : 0=0.0%, 4=100.0%, 8=0.0%, 16=0.0%, 32=0.0%, 64=0.0%, >=64=0.0%
     complete  : 0=0.0%, 4=100.0%, 8=0.0%, 16=0.0%, 32=0.1%, 64=0.0%, >=64=0.0%
     issued rwts: total=0,8388608,0,0 short=0,0,0,0 dropped=0,0,0,0
     latency   : target=0, window=0, percentile=100.00%, depth=32

Run status group 0 (all jobs):
  WRITE: bw=336MiB/s (353MB/s), 336MiB/s-336MiB/s (353MB/s-353MB/s), io=32.0GiB (34.4GB), run=97467-97467msec

Disk stats (read/write):
  sdc: ios=0/8376016, merge=0/6243, ticks=0/5841669, in_queue=3119248, util=100.00%
nvme_randwrite: (g=0): rw=randwrite, bs=(R) 4096B-4096B, (W) 4096B-4096B, (T) 4096B-4096B, ioengine=libaio, iodepth=32
...
fio-3.13-42-g8066f
Starting 4 processes

nvme_randwrite: (groupid=0, jobs=4): err= 0: pid=22776: Mon May 27 11:28:41 2019
  write: IOPS=435k, BW=1698MiB/s (1780MB/s)(32.0GiB/19299msec); 0 zone resets
   bw (  MiB/s): min= 1668, max= 1727, per=100.00%, avg=1697.90, stdev= 3.49, samples=152
   iops        : min=427190, max=442344, avg=434663.08, stdev=894.54, samples=152
  cpu          : usr=10.11%, sys=53.60%, ctx=1691030, majf=0, minf=38
  IO depths    : 1=0.1%, 2=0.1%, 4=0.1%, 8=0.1%, 16=0.1%, 32=100.0%, >=64=0.0%
     submit    : 0=0.0%, 4=100.0%, 8=0.0%, 16=0.0%, 32=0.0%, 64=0.0%, >=64=0.0%
     complete  : 0=0.0%, 4=100.0%, 8=0.0%, 16=0.0%, 32=0.1%, 64=0.0%, >=64=0.0%
     issued rwts: total=0,8388608,0,0 short=0,0,0,0 dropped=0,0,0,0
     latency   : target=0, window=0, percentile=100.00%, depth=32

Run status group 0 (all jobs):
  WRITE: bw=1698MiB/s (1780MB/s), 1698MiB/s-1698MiB/s (1780MB/s-1780MB/s), io=32.0GiB (34.4GB), run=19299-19299msec

Disk stats (read/write):
  nvme0n1: ios=0/8322950, merge=0/3, ticks=0/2255895, in_queue=2510004, util=100.00%
hdd_randwrite: (g=0): rw=randwrite, bs=(R) 4096B-4096B, (W) 4096B-4096B, (T) 4096B-4096B, ioengine=libaio, iodepth=32
...
fio-3.13-42-g8066f
Starting 4 processes

hdd_randwrite: (groupid=0, jobs=4): err= 0: pid=22802: Mon May 27 12:28:52 2019
  write: IOPS=74, BW=298KiB/s (305kB/s)(1051MiB/3610638msec); 0 zone resets
   bw (  KiB/s): min=   28, max=11138, per=100.00%, avg=1200.85, stdev=596.45, samples=7165
   iops        : min=    4, max= 2784, avg=300.01, stdev=149.12, samples=7165
  cpu          : usr=0.01%, sys=0.07%, ctx=141548, majf=0, minf=34
  IO depths    : 1=0.1%, 2=0.1%, 4=0.1%, 8=0.1%, 16=0.1%, 32=100.0%, >=64=0.0%
     submit    : 0=0.0%, 4=100.0%, 8=0.0%, 16=0.0%, 32=0.0%, 64=0.0%, >=64=0.0%
     complete  : 0=0.0%, 4=100.0%, 8=0.0%, 16=0.0%, 32=0.1%, 64=0.0%, >=64=0.0%
     issued rwts: total=0,269048,0,0 short=0,0,0,0 dropped=0,0,0,0
     latency   : target=0, window=0, percentile=100.00%, depth=32

Run status group 0 (all jobs):
  WRITE: bw=298KiB/s (305kB/s), 298KiB/s-298KiB/s (305kB/s-305kB/s), io=1051MiB (1102MB), run=3610638-3610638msec

Disk stats (read/write):
  sdd: ios=0/269976, merge=0/476, ticks=0/201913479, in_queue=12552396, util=13.33%
fast-raid1_randwrite: (g=0): rw=randwrite, bs=(R) 4096B-4096B, (W) 4096B-4096B, (T) 4096B-4096B, ioengine=libaio, iodepth=32
...
fio-3.13-42-g8066f
Starting 4 processes

fast-raid1_randwrite: (groupid=0, jobs=4): err= 0: pid=23340: Mon May 27 12:30:35 2019
  write: IOPS=82.2k, BW=321MiB/s (337MB/s)(32.0GiB/102044msec); 0 zone resets
   bw (  KiB/s): min=310456, max=366517, per=100.00%, avg=328899.58, stdev=1230.46, samples=811
   iops        : min=77614, max=91629, avg=82224.78, stdev=307.61, samples=811
  cpu          : usr=2.49%, sys=34.63%, ctx=970337, majf=0, minf=35
  IO depths    : 1=0.1%, 2=0.1%, 4=0.1%, 8=0.1%, 16=0.1%, 32=100.0%, >=64=0.0%
     submit    : 0=0.0%, 4=100.0%, 8=0.0%, 16=0.0%, 32=0.0%, 64=0.0%, >=64=0.0%
     complete  : 0=0.0%, 4=100.0%, 8=0.0%, 16=0.0%, 32=0.1%, 64=0.0%, >=64=0.0%
     issued rwts: total=0,8388608,0,0 short=0,0,0,0 dropped=0,0,0,0
     latency   : target=0, window=0, percentile=100.00%, depth=32

Run status group 0 (all jobs):
  WRITE: bw=321MiB/s (337MB/s), 321MiB/s-321MiB/s (337MB/s-337MB/s), io=32.0GiB (34.4GB), run=102044-102044msec

Disk stats (read/write):
    md4: ios=0/8376311, merge=0/0, ticks=0/0, in_queue=0, util=0.00%, aggrios=0/8388659, aggrmerge=0/20, aggrticks=0/704846, aggrin_queue=735954, aggrutil=100.00%
  sdc: ios=0/8388669, merge=0/20, ticks=0/1287644, in_queue=1244548, util=98.44%
  nvme0n1: ios=0/8388649, merge=0/20, ticks=0/122048, in_queue=227360, util=100.00%
fast-raid10_randwrite: (g=0): rw=randwrite, bs=(R) 4096B-4096B, (W) 4096B-4096B, (T) 4096B-4096B, ioengine=libaio, iodepth=32
...
fio-3.13-42-g8066f
Starting 4 processes

fast-raid10_randwrite: (groupid=0, jobs=4): err= 0: pid=23379: Mon May 27 12:32:17 2019
  write: IOPS=82.2k, BW=321MiB/s (337MB/s)(32.0GiB/102002msec); 0 zone resets
   bw (  KiB/s): min=310944, max=407752, per=100.00%, avg=329334.69, stdev=2083.52, samples=810
   iops        : min=77736, max=101937, avg=82333.63, stdev=520.86, samples=810
  cpu          : usr=2.41%, sys=35.05%, ctx=960868, majf=0, minf=31
  IO depths    : 1=0.1%, 2=0.1%, 4=0.1%, 8=0.1%, 16=0.1%, 32=100.0%, >=64=0.0%
     submit    : 0=0.0%, 4=100.0%, 8=0.0%, 16=0.0%, 32=0.0%, 64=0.0%, >=64=0.0%
     complete  : 0=0.0%, 4=100.0%, 8=0.0%, 16=0.0%, 32=0.1%, 64=0.0%, >=64=0.0%
     issued rwts: total=0,8388608,0,0 short=0,0,0,0 dropped=0,0,0,0
     latency   : target=0, window=0, percentile=100.00%, depth=32

Run status group 0 (all jobs):
  WRITE: bw=321MiB/s (337MB/s), 321MiB/s-321MiB/s (337MB/s-337MB/s), io=32.0GiB (34.4GB), run=102002-102002msec

Disk stats (read/write):
    md5: ios=0/8379512, merge=0/0, ticks=0/0, in_queue=0, util=0.00%, aggrios=0/8388666, aggrmerge=0/21, aggrticks=0/704190, aggrin_queue=738060, aggrutil=100.00%
  nvme0n1: ios=0/8388656, merge=0/21, ticks=0/121112, in_queue=220276, util=100.00%
  sdc: ios=0/8388677, merge=0/21, ticks=0/1287268, in_queue=1255844, util=98.63%
slow-raid1_randwrite: (g=0): rw=randwrite, bs=(R) 4096B-4096B, (W) 4096B-4096B, (T) 4096B-4096B, ioengine=libaio, iodepth=32
...
fio-3.13-42-g8066f
Starting 4 processes

slow-raid1_randwrite: (groupid=0, jobs=4): err= 0: pid=23420: Mon May 27 13:32:27 2019
  write: IOPS=25, BW=100KiB/s (102kB/s)(352MiB/3608832msec); 0 zone resets
   bw (  KiB/s): min=   28, max= 7240, per=100.00%, avg=281.88, stdev=142.99, samples=10204
   iops        : min=    4, max= 1810, avg=70.09, stdev=35.76, samples=10204
  cpu          : usr=0.00%, sys=0.03%, ctx=27556, majf=0, minf=30
  IO depths    : 1=0.1%, 2=0.1%, 4=0.1%, 8=0.1%, 16=0.1%, 32=99.9%, >=64=0.0%
     submit    : 0=0.0%, 4=100.0%, 8=0.0%, 16=0.0%, 32=0.0%, 64=0.0%, >=64=0.0%
     complete  : 0=0.0%, 4=100.0%, 8=0.0%, 16=0.0%, 32=0.1%, 64=0.0%, >=64=0.0%
     issued rwts: total=0,90232,0,0 short=0,0,0,0 dropped=0,0,0,0
     latency   : target=0, window=0, percentile=100.00%, depth=32

Run status group 0 (all jobs):
  WRITE: bw=100KiB/s (102kB/s), 100KiB/s-100KiB/s (102kB/s-102kB/s), io=352MiB (370MB), run=3608832-3608832msec

Disk stats (read/write):
    md6: ios=0/91688, merge=0/0, ticks=0/0, in_queue=0, util=0.00%, aggrios=0/91744, aggrmerge=0/497, aggrticks=0/44113055, aggrin_queue=4778486, aggrutil=14.52%
  sde: ios=0/91740, merge=0/502, ticks=0/7593320, in_queue=354720, util=1.31%
  sdd: ios=0/91749, merge=0/493, ticks=0/80632791, in_queue=9202252, util=14.52%
slow-raid10_randwrite: (g=0): rw=randwrite, bs=(R) 4096B-4096B, (W) 4096B-4096B, (T) 4096B-4096B, ioengine=libaio, iodepth=32
...
fio-3.13-42-g8066f
Starting 4 processes

slow-raid10_randwrite: (groupid=0, jobs=4): err= 0: pid=23949: Mon May 27 14:32:34 2019
  write: IOPS=21, BW=85.6KiB/s (87.6kB/s)(301MiB/3606668msec); 0 zone resets
   bw (  KiB/s): min=   28, max= 4784, per=100.00%, avg=229.85, stdev=74.19, samples=10698
   iops        : min=    4, max= 1196, avg=57.11, stdev=18.56, samples=10698
  cpu          : usr=0.00%, sys=0.03%, ctx=25045, majf=0, minf=34
  IO depths    : 1=0.1%, 2=0.1%, 4=0.1%, 8=0.1%, 16=0.1%, 32=99.8%, >=64=0.0%
     submit    : 0=0.0%, 4=100.0%, 8=0.0%, 16=0.0%, 32=0.0%, 64=0.0%, >=64=0.0%
     complete  : 0=0.0%, 4=100.0%, 8=0.0%, 16=0.0%, 32=0.1%, 64=0.0%, >=64=0.0%
     issued rwts: total=0,77176,0,0 short=0,0,0,0 dropped=0,0,0,0
     latency   : target=0, window=0, percentile=100.00%, depth=32

Run status group 0 (all jobs):
  WRITE: bw=85.6KiB/s (87.6kB/s), 85.6KiB/s-85.6KiB/s (87.6kB/s-87.6kB/s), io=301MiB (316MB), run=3606668-3606668msec

Disk stats (read/write):
    md7: ios=0/78691, merge=0/0, ticks=0/0, in_queue=0, util=0.00%, aggrios=0/78719, aggrmerge=0/506, aggrticks=0/43822275, aggrin_queue=5006454, aggrutil=15.52%
  sde: ios=0/78716, merge=0/510, ticks=0/6980884, in_queue=264756, util=1.18%
  sdd: ios=0/78723, merge=0/503, ticks=0/80663667, in_queue=9748152, util=15.52%
ssd_rand40read: (g=0): rw=randrw, bs=(R) 4096B-4096B, (W) 4096B-4096B, (T) 4096B-4096B, ioengine=libaio, iodepth=32
...
fio-3.13-42-g8066f
Starting 4 processes


ssd_rand40read: (groupid=0, jobs=4): err= 0: pid=24459: Mon May 27 14:34:07 2019
  read: IOPS=36.3k, BW=142MiB/s (148MB/s)(12.8GiB/92604msec)
   bw (  KiB/s): min=137354, max=157789, per=99.98%, avg=144980.14, stdev=914.61, samples=736
   iops        : min=34338, max=39447, avg=36244.96, stdev=228.66, samples=736
  write: IOPS=54.3k, BW=212MiB/s (223MB/s)(19.2GiB/92604msec); 0 zone resets
   bw (  KiB/s): min=207912, max=235496, per=99.98%, avg=217284.77, stdev=1277.34, samples=736
   iops        : min=51978, max=58874, avg=54321.11, stdev=319.33, samples=736
  cpu          : usr=3.47%, sys=23.54%, ctx=7633204, majf=0, minf=39
  IO depths    : 1=0.1%, 2=0.1%, 4=0.1%, 8=0.1%, 16=0.1%, 32=100.0%, >=64=0.0%
     submit    : 0=0.0%, 4=100.0%, 8=0.0%, 16=0.0%, 32=0.0%, 64=0.0%, >=64=0.0%
     complete  : 0=0.0%, 4=100.0%, 8=0.0%, 16=0.0%, 32=0.1%, 64=0.0%, >=64=0.0%
     issued rwts: total=3357227,5031381,0,0 short=0,0,0,0 dropped=0,0,0,0
     latency   : target=0, window=0, percentile=100.00%, depth=32

Run status group 0 (all jobs):
   READ: bw=142MiB/s (148MB/s), 142MiB/s-142MiB/s (148MB/s-148MB/s), io=12.8GiB (13.8GB), run=92604-92604msec
  WRITE: bw=212MiB/s (223MB/s), 212MiB/s-212MiB/s (223MB/s-223MB/s), io=19.2GiB (20.6GB), run=92604-92604msec

Disk stats (read/write):
  sdc: ios=3348978/5017641, merge=412/1987, ticks=1832516/3506648, in_queue=2964760, util=100.00%
nvme_rand40read: (g=0): rw=randrw, bs=(R) 4096B-4096B, (W) 4096B-4096B, (T) 4096B-4096B, ioengine=libaio, iodepth=32
...
fio-3.13-42-g8066f
Starting 4 processes

nvme_rand40read: (groupid=0, jobs=4): err= 0: pid=24494: Mon May 27 14:34:28 2019
  read: IOPS=168k, BW=655MiB/s (687MB/s)(12.8GiB/20018msec)
   bw (  KiB/s): min=648952, max=688768, per=100.00%, avg=671058.81, stdev=2513.53, samples=159
   iops        : min=162238, max=172192, avg=167764.64, stdev=628.37, samples=159
  write: IOPS=251k, BW=982MiB/s (1030MB/s)(19.2GiB/20018msec); 0 zone resets
   bw (  KiB/s): min=974008, max=1030368, per=100.00%, avg=1005678.16, stdev=3716.60, samples=159
   iops        : min=243502, max=257592, avg=251419.50, stdev=929.15, samples=159
  cpu          : usr=8.58%, sys=46.68%, ctx=6081666, majf=0, minf=37
  IO depths    : 1=0.1%, 2=0.1%, 4=0.1%, 8=0.1%, 16=0.1%, 32=100.0%, >=64=0.0%
     submit    : 0=0.0%, 4=100.0%, 8=0.0%, 16=0.0%, 32=0.0%, 64=0.0%, >=64=0.0%
     complete  : 0=0.0%, 4=100.0%, 8=0.0%, 16=0.0%, 32=0.1%, 64=0.0%, >=64=0.0%
     issued rwts: total=3357227,5031381,0,0 short=0,0,0,0 dropped=0,0,0,0
     latency   : target=0, window=0, percentile=100.00%, depth=32

Run status group 0 (all jobs):
   READ: bw=655MiB/s (687MB/s), 655MiB/s-655MiB/s (687MB/s-687MB/s), io=12.8GiB (13.8GB), run=20018-20018msec
  WRITE: bw=982MiB/s (1030MB/s), 982MiB/s-982MiB/s (1030MB/s-1030MB/s), io=19.2GiB (20.6GB), run=20018-20018msec

Disk stats (read/write):
  nvme0n1: ios=3337290/5001689, merge=0/3, ticks=1181649/890715, in_queue=2237796, util=100.00%
hdd_rand40read: (g=0): rw=randrw, bs=(R) 4096B-4096B, (W) 4096B-4096B, (T) 4096B-4096B, ioengine=libaio, iodepth=32
...
fio-3.13-42-g8066f
Starting 4 processes

hdd_rand40read: (groupid=0, jobs=4): err= 0: pid=24517: Mon May 27 15:34:29 2019
  read: IOPS=19, BW=77.5KiB/s (79.3kB/s)(273MiB/3601333msec)
   bw (  KiB/s): min=   28, max= 1016, per=100.00%, avg=184.05, stdev=37.32, samples=12089
   iops        : min=    4, max=  254, avg=45.65, stdev= 9.33, samples=12089
  write: IOPS=29, BW=116KiB/s (119kB/s)(408MiB/3601333msec); 0 zone resets
   bw (  KiB/s): min=   28, max= 1518, per=100.00%, avg=246.94, stdev=53.96, samples=13515
   iops        : min=    4, max=  378, avg=61.37, stdev=13.48, samples=13515
  cpu          : usr=0.01%, sys=0.04%, ctx=147402, majf=0, minf=34
  IO depths    : 1=0.1%, 2=0.1%, 4=0.1%, 8=0.1%, 16=0.1%, 32=99.9%, >=64=0.0%
     submit    : 0=0.0%, 4=100.0%, 8=0.0%, 16=0.0%, 32=0.0%, 64=0.0%, >=64=0.0%
     complete  : 0=0.0%, 4=100.0%, 8=0.0%, 16=0.0%, 32=0.1%, 64=0.0%, >=64=0.0%
     issued rwts: total=69764,104564,0,0 short=0,0,0,0 dropped=0,0,0,0
     latency   : target=0, window=0, percentile=100.00%, depth=32

Run status group 0 (all jobs):
   READ: bw=77.5KiB/s (79.3kB/s), 77.5KiB/s-77.5KiB/s (79.3kB/s-79.3kB/s), io=273MiB (286MB), run=3601333-3601333msec
  WRITE: bw=116KiB/s (119kB/s), 116KiB/s-116KiB/s (119kB/s-119kB/s), io=408MiB (428MB), run=3601333-3601333msec

Disk stats (read/write):
  sdd: ios=69754/105816, merge=0/638, ticks=60387351/139632687, in_queue=34094648, util=38.38%
fast-raid1_rand40read: (g=0): rw=randrw, bs=(R) 4096B-4096B, (W) 4096B-4096B, (T) 4096B-4096B, ioengine=libaio, iodepth=32
...
fio-3.13-42-g8066f
Starting 4 processes

fast-raid1_rand40read: (groupid=0, jobs=4): err= 0: pid=24996: Mon May 27 15:35:33 2019
  read: IOPS=53.6k, BW=210MiB/s (220MB/s)(12.8GiB/62577msec)
   bw (  KiB/s): min=203040, max=225448, per=99.99%, avg=214565.85, stdev=864.07, samples=496
   iops        : min=50760, max=56362, avg=53641.38, stdev=216.01, samples=496
  write: IOPS=80.4k, BW=314MiB/s (329MB/s)(19.2GiB/62577msec); 0 zone resets
   bw (  KiB/s): min=306304, max=334360, per=99.99%, avg=321567.38, stdev=960.94, samples=496
   iops        : min=76576, max=83590, avg=80391.76, stdev=240.24, samples=496
  cpu          : usr=3.93%, sys=38.31%, ctx=6189944, majf=0, minf=31
  IO depths    : 1=0.1%, 2=0.1%, 4=0.1%, 8=0.1%, 16=0.1%, 32=100.0%, >=64=0.0%
     submit    : 0=0.0%, 4=100.0%, 8=0.0%, 16=0.0%, 32=0.0%, 64=0.0%, >=64=0.0%
     complete  : 0=0.0%, 4=100.0%, 8=0.0%, 16=0.0%, 32=0.1%, 64=0.0%, >=64=0.0%
     issued rwts: total=3357227,5031381,0,0 short=0,0,0,0 dropped=0,0,0,0
     latency   : target=0, window=0, percentile=100.00%, depth=32

Run status group 0 (all jobs):
   READ: bw=210MiB/s (220MB/s), 210MiB/s-210MiB/s (220MB/s-220MB/s), io=12.8GiB (13.8GB), run=62577-62577msec
  WRITE: bw=314MiB/s (329MB/s), 314MiB/s-314MiB/s (329MB/s-329MB/s), io=19.2GiB (20.6GB), run=62577-62577msec

Disk stats (read/write):
    md4: ios=3347484/5016809, merge=0/0, ticks=0/0, in_queue=0, util=0.00%, aggrios=1678613/5031412, aggrmerge=0/12, aggrticks=203582/449275, aggrin_queue=667070, aggrutil=100.00%
  sdc: ios=214068/5031418, merge=0/12, ticks=55301/827759, in_queue=870720, util=99.41%
  nvme0n1: ios=3143159/5031406, merge=0/12, ticks=351863/70792, in_queue=463420, util=100.00%
fast-raid10_rand40read: (g=0): rw=randrw, bs=(R) 4096B-4096B, (W) 4096B-4096B, (T) 4096B-4096B, ioengine=libaio, iodepth=32
...
fio-3.13-42-g8066f
Starting 4 processes

fast-raid10_rand40read: (groupid=0, jobs=4): err= 0: pid=25027: Mon May 27 15:36:50 2019
  read: IOPS=43.6k, BW=170MiB/s (178MB/s)(12.8GiB/77071msec)
   bw (  KiB/s): min=165472, max=184784, per=99.99%, avg=174214.65, stdev=1009.55, samples=612
   iops        : min=41368, max=46196, avg=43553.61, stdev=252.39, samples=612
  write: IOPS=65.3k, BW=255MiB/s (267MB/s)(19.2GiB/77071msec); 0 zone resets
   bw (  KiB/s): min=250816, max=274536, per=99.99%, avg=261091.16, stdev=1363.52, samples=612
   iops        : min=62704, max=68634, avg=65272.73, stdev=340.88, samples=612
  cpu          : usr=3.59%, sys=34.08%, ctx=6235718, majf=0, minf=37
  IO depths    : 1=0.1%, 2=0.1%, 4=0.1%, 8=0.1%, 16=0.1%, 32=100.0%, >=64=0.0%
     submit    : 0=0.0%, 4=100.0%, 8=0.0%, 16=0.0%, 32=0.0%, 64=0.0%, >=64=0.0%
     complete  : 0=0.0%, 4=100.0%, 8=0.0%, 16=0.0%, 32=0.1%, 64=0.0%, >=64=0.0%
     issued rwts: total=3357227,5031381,0,0 short=0,0,0,0 dropped=0,0,0,0
     latency   : target=0, window=0, percentile=100.00%, depth=32

Run status group 0 (all jobs):
   READ: bw=170MiB/s (178MB/s), 170MiB/s-170MiB/s (178MB/s-178MB/s), io=12.8GiB (13.8GB), run=77071-77071msec
  WRITE: bw=255MiB/s (267MB/s), 255MiB/s-255MiB/s (267MB/s-267MB/s), io=19.2GiB (20.6GB), run=77071-77071msec

Disk stats (read/write):
    md5: ios=3349230/5019464, merge=0/0, ticks=0/0, in_queue=0, util=0.00%, aggrios=1678605/5031368, aggrmerge=7/75, aggrticks=375482/535122, aggrin_queue=907140, aggrutil=100.00%
  nvme0n1: ios=1683181/5031419, merge=0/16, ticks=173697/68306, in_queue=286432, util=100.00%
  sdc: ios=1674030/5031317, merge=15/134, ticks=577268/1001938, in_queue=1527848, util=100.00%
slow-raid1_rand40read: (g=0): rw=randrw, bs=(R) 4096B-4096B, (W) 4096B-4096B, (T) 4096B-4096B, ioengine=libaio, iodepth=32
...
fio-3.13-42-g8066f
Starting 4 processes

slow-raid1_rand40read: (groupid=0, jobs=4): err= 0: pid=25058: Mon May 27 16:36:51 2019
  read: IOPS=25, BW=102KiB/s (104kB/s)(359MiB/3600363msec)
   bw (  KiB/s): min=   28, max= 1567, per=100.00%, avg=190.82, stdev=48.94, samples=15352
   iops        : min=    4, max=  391, avg=47.44, stdev=12.23, samples=15352
  write: IOPS=38, BW=154KiB/s (157kB/s)(540MiB/3600363msec); 0 zone resets
   bw (  KiB/s): min=   28, max= 2408, per=100.00%, avg=262.88, stdev=75.86, samples=16781
   iops        : min=    4, max=  602, avg=65.46, stdev=18.96, samples=16781
  cpu          : usr=0.01%, sys=0.07%, ctx=170981, majf=0, minf=36
  IO depths    : 1=0.1%, 2=0.1%, 4=0.1%, 8=0.1%, 16=0.1%, 32=99.9%, >=64=0.0%
     submit    : 0=0.0%, 4=100.0%, 8=0.0%, 16=0.0%, 32=0.0%, 64=0.0%, >=64=0.0%
     complete  : 0=0.0%, 4=100.0%, 8=0.0%, 16=0.0%, 32=0.1%, 64=0.0%, >=64=0.0%
     issued rwts: total=91801,138207,0,0 short=0,0,0,0 dropped=0,0,0,0
     latency   : target=0, window=0, percentile=100.00%, depth=32

Run status group 0 (all jobs):
   READ: bw=102KiB/s (104kB/s), 102KiB/s-102KiB/s (104kB/s-104kB/s), io=359MiB (376MB), run=3600363-3600363msec
  WRITE: bw=154KiB/s (157kB/s), 154KiB/s-154KiB/s (157kB/s-157kB/s), io=540MiB (566MB), run=3600363-3600363msec

Disk stats (read/write):
    md6: ios=91779/140158, merge=0/0, ticks=0/0, in_queue=0, util=0.00%, aggrios=45900/140208, aggrmerge=0/656, aggrticks=14202214/30211957, aggrin_queue=12491444, aggrutil=48.18%
  sde: ios=39664/140200, merge=0/664, ticks=2840484/5209092, in_queue=2804348, util=9.82%
  sdd: ios=52137/140216, merge=0/648, ticks=25563944/55214822, in_queue=22178540, util=48.18%
slow-raid10_rand40read: (g=0): rw=randrw, bs=(R) 4096B-4096B, (W) 4096B-4096B, (T) 4096B-4096B, ioengine=libaio, iodepth=32
...
fio-3.13-42-g8066f
Starting 4 processes

slow-raid10_rand40read: (groupid=0, jobs=4): err= 0: pid=25714: Mon May 27 17:37:04 2019
  read: IOPS=17, BW=70.0KiB/s (71.7kB/s)(247MiB/3612868msec)
   bw (  KiB/s): min=   27, max= 1216, per=100.00%, avg=162.19, stdev=41.06, samples=12423
   iops        : min=    4, max=  304, avg=40.09, stdev=10.27, samples=12423
  write: IOPS=26, BW=105KiB/s (108kB/s)(371MiB/3612868msec); 0 zone resets
   bw (  KiB/s): min=   27, max= 2024, per=100.00%, avg=223.10, stdev=64.70, samples=13569
   iops        : min=    4, max=  506, avg=55.32, stdev=16.17, samples=13569
  cpu          : usr=0.01%, sys=0.05%, ctx=122921, majf=0, minf=39
  IO depths    : 1=0.1%, 2=0.1%, 4=0.1%, 8=0.1%, 16=0.1%, 32=99.9%, >=64=0.0%
     submit    : 0=0.0%, 4=100.0%, 8=0.0%, 16=0.0%, 32=0.0%, 64=0.0%, >=64=0.0%
     complete  : 0=0.0%, 4=100.0%, 8=0.0%, 16=0.0%, 32=0.1%, 64=0.0%, >=64=0.0%
     issued rwts: total=63249,94951,0,0 short=0,0,0,0 dropped=0,0,0,0
     latency   : target=0, window=0, percentile=100.00%, depth=32

Run status group 0 (all jobs):
   READ: bw=70.0KiB/s (71.7kB/s), 70.0KiB/s-70.0KiB/s (71.7kB/s-71.7kB/s), io=247MiB (259MB), run=3612868-3612868msec
  WRITE: bw=105KiB/s (108kB/s), 105KiB/s-105KiB/s (108kB/s-108kB/s), io=371MiB (389MB), run=3612868-3612868msec

Disk stats (read/write):
    md7: ios=63249/96781, merge=0/0, ticks=0/0, in_queue=0, util=0.00%, aggrios=31624/96881, aggrmerge=0/522, aggrticks=15497107/37413184, aggrin_queue=10284966, aggrutil=35.60%
  sde: ios=27131/96796, merge=0/608, ticks=8770894/25815301, in_queue=5907956, util=18.62%
  sdd: ios=36118/96966, merge=0/436, ticks=22223321/49011067, in_queue=14661976, util=35.60%
ssd_rand75read: (g=0): rw=randrw, bs=(R) 4096B-4096B, (W) 4096B-4096B, (T) 4096B-4096B, ioengine=libaio, iodepth=32
...
fio-3.13-42-g8066f
Starting 4 processes

ssd_rand75read: (groupid=0, jobs=4): err= 0: pid=26527: Mon May 27 17:38:33 2019
  read: IOPS=71.0k, BW=278MiB/s (291MB/s)(23.0GiB/88532msec)
   bw (  KiB/s): min=255176, max=491472, per=100.00%, avg=287151.98, stdev=8804.16, samples=697
   iops        : min=63794, max=122866, avg=71787.92, stdev=2201.03, samples=697
  write: IOPS=23.7k, BW=92.6MiB/s (97.1MB/s)(8198MiB/88532msec); 0 zone resets
   bw (  KiB/s): min=83320, max=165016, per=100.00%, avg=95816.08, stdev=2959.11, samples=697
   iops        : min=20830, max=41254, avg=23953.99, stdev=739.78, samples=697
  cpu          : usr=3.84%, sys=20.61%, ctx=5531570, majf=0, minf=34
  IO depths    : 1=0.1%, 2=0.1%, 4=0.1%, 8=0.1%, 16=0.1%, 32=100.0%, >=64=0.0%
     submit    : 0=0.0%, 4=100.0%, 8=0.0%, 16=0.0%, 32=0.0%, 64=0.0%, >=64=0.0%
     complete  : 0=0.0%, 4=100.0%, 8=0.0%, 16=0.0%, 32=0.1%, 64=0.0%, >=64=0.0%
     issued rwts: total=6290017,2098591,0,0 short=0,0,0,0 dropped=0,0,0,0
     latency   : target=0, window=0, percentile=100.00%, depth=32

Run status group 0 (all jobs):
   READ: bw=278MiB/s (291MB/s), 278MiB/s-278MiB/s (291MB/s-291MB/s), io=23.0GiB (25.8GB), run=88532-88532msec
  WRITE: bw=92.6MiB/s (97.1MB/s), 92.6MiB/s-92.6MiB/s (97.1MB/s-97.1MB/s), io=8198MiB (8596MB), run=88532-88532msec

Disk stats (read/write):
  sdc: ios=6276704/2094912, merge=3430/421, ticks=3570460/1234860, in_queue=2836220, util=100.00%
nvme_rand75read: (g=0): rw=randrw, bs=(R) 4096B-4096B, (W) 4096B-4096B, (T) 4096B-4096B, ioengine=libaio, iodepth=32
...
fio-3.13-42-g8066f
Starting 4 processes

nvme_rand75read: (groupid=0, jobs=4): err= 0: pid=26568: Mon May 27 17:38:52 2019
  read: IOPS=340k, BW=1327MiB/s (1391MB/s)(23.0GiB/18522msec)
   bw (  MiB/s): min= 1294, max= 1356, per=100.00%, avg=1326.84, stdev= 4.07, samples=147
   iops        : min=331282, max=347170, avg=339670.68, stdev=1041.42, samples=147
  write: IOPS=113k, BW=443MiB/s (464MB/s)(8198MiB/18522msec); 0 zone resets
   bw (  KiB/s): min=438432, max=465144, per=100.00%, avg=453358.86, stdev=1646.16, samples=147
   iops        : min=109608, max=116286, avg=113339.71, stdev=411.56, samples=147
  cpu          : usr=10.14%, sys=46.86%, ctx=5103055, majf=0, minf=40
  IO depths    : 1=0.1%, 2=0.1%, 4=0.1%, 8=0.1%, 16=0.1%, 32=100.0%, >=64=0.0%
     submit    : 0=0.0%, 4=100.0%, 8=0.0%, 16=0.0%, 32=0.0%, 64=0.0%, >=64=0.0%
     complete  : 0=0.0%, 4=100.0%, 8=0.0%, 16=0.0%, 32=0.1%, 64=0.0%, >=64=0.0%
     issued rwts: total=6290017,2098591,0,0 short=0,0,0,0 dropped=0,0,0,0
     latency   : target=0, window=0, percentile=100.00%, depth=32

Run status group 0 (all jobs):
   READ: bw=1327MiB/s (1391MB/s), 1327MiB/s-1327MiB/s (1391MB/s-1391MB/s), io=23.0GiB (25.8GB), run=18522-18522msec
  WRITE: bw=443MiB/s (464MB/s), 443MiB/s-443MiB/s (464MB/s-464MB/s), io=8198MiB (8596MB), run=18522-18522msec

Disk stats (read/write):
  nvme0n1: ios=6248647/2084929, merge=0/3, ticks=1873327/160609, in_queue=2202800, util=100.00%
hdd_rand75read: (g=0): rw=randrw, bs=(R) 4096B-4096B, (W) 4096B-4096B, (T) 4096B-4096B, ioengine=libaio, iodepth=32
...
fio-3.13-42-g8066f
Starting 4 processes

hdd_rand75read: (groupid=0, jobs=4): err= 0: pid=26596: Mon May 27 18:38:55 2019
  read: IOPS=56, BW=226KiB/s (231kB/s)(794MiB/3602251msec)
   bw (  KiB/s): min=   28, max= 1448, per=100.00%, avg=418.58, stdev=77.89, samples=15527
   iops        : min=    4, max=  362, avg=104.55, stdev=19.47, samples=15527
  write: IOPS=18, BW=75.6KiB/s (77.4kB/s)(266MiB/3602251msec); 0 zone resets
   bw (  KiB/s): min=   28, max=  728, per=100.00%, avg=171.33, stdev=30.27, samples=12702
   iops        : min=    4, max=  182, avg=42.73, stdev= 7.57, samples=12702
  cpu          : usr=0.01%, sys=0.05%, ctx=186498, majf=0, minf=39
  IO depths    : 1=0.1%, 2=0.1%, 4=0.1%, 8=0.1%, 16=0.1%, 32=100.0%, >=64=0.0%
     submit    : 0=0.0%, 4=100.0%, 8=0.0%, 16=0.0%, 32=0.0%, 64=0.0%, >=64=0.0%
     complete  : 0=0.0%, 4=100.0%, 8=0.0%, 16=0.0%, 32=0.1%, 64=0.0%, >=64=0.0%
     issued rwts: total=203244,68108,0,0 short=0,0,0,0 dropped=0,0,0,0
     latency   : target=0, window=0, percentile=100.00%, depth=32

Run status group 0 (all jobs):
   READ: bw=226KiB/s (231kB/s), 226KiB/s-226KiB/s (231kB/s-231kB/s), io=794MiB (832MB), run=3602251-3602251msec
  WRITE: bw=75.6KiB/s (77.4kB/s), 75.6KiB/s-75.6KiB/s (77.4kB/s-77.4kB/s), io=266MiB (279MB), run=3602251-3602251msec

Disk stats (read/write):
  sdd: ios=203238/69356, merge=3/630, ticks=136092993/55058765, in_queue=45116208, util=48.88%
fast-raid1_rand75read: (g=0): rw=randrw, bs=(R) 4096B-4096B, (W) 4096B-4096B, (T) 4096B-4096B, ioengine=libaio, iodepth=32
...
fio-3.13-42-g8066f
Starting 4 processes

fast-raid1_rand75read: (groupid=0, jobs=4): err= 0: pid=27367: Mon May 27 18:39:32 2019
  read: IOPS=176k, BW=686MiB/s (719MB/s)(23.0GiB/35835msec)
   bw (  KiB/s): min=660240, max=717336, per=99.98%, avg=701957.38, stdev=2252.52, samples=284
   iops        : min=165060, max=179334, avg=175489.34, stdev=563.13, samples=284
  write: IOPS=58.6k, BW=229MiB/s (240MB/s)(8198MiB/35835msec); 0 zone resets
   bw (  KiB/s): min=222680, max=240808, per=100.00%, avg=234241.37, stdev=724.34, samples=284
   iops        : min=55670, max=60202, avg=58560.31, stdev=181.09, samples=284
  cpu          : usr=5.87%, sys=43.43%, ctx=4398551, majf=0, minf=35
  IO depths    : 1=0.1%, 2=0.1%, 4=0.1%, 8=0.1%, 16=0.1%, 32=100.0%, >=64=0.0%
     submit    : 0=0.0%, 4=100.0%, 8=0.0%, 16=0.0%, 32=0.0%, 64=0.0%, >=64=0.0%
     complete  : 0=0.0%, 4=100.0%, 8=0.0%, 16=0.0%, 32=0.1%, 64=0.0%, >=64=0.0%
     issued rwts: total=6290017,2098591,0,0 short=0,0,0,0 dropped=0,0,0,0
     latency   : target=0, window=0, percentile=100.00%, depth=32

Run status group 0 (all jobs):
   READ: bw=686MiB/s (719MB/s), 686MiB/s-686MiB/s (719MB/s-719MB/s), io=23.0GiB (25.8GB), run=35835-35835msec
  WRITE: bw=229MiB/s (240MB/s), 229MiB/s-229MiB/s (240MB/s-240MB/s), io=8198MiB (8596MB), run=35835-35835msec

Disk stats (read/write):
    md4: ios=6256195/2087439, merge=0/0, ticks=0/0, in_queue=0, util=0.00%, aggrios=3144990/2098586, aggrmerge=18/30, aggrticks=475920/253361, aggrin_queue=725774, aggrutil=100.00%
  sdc: ios=1046956/2098567, merge=36/53, ticks=367915/478540, in_queue=802572, util=99.83%
  nvme0n1: ios=5243025/2098606, merge=0/7, ticks=583926/28183, in_queue=648976, util=100.00%
fast-raid10_rand75read: (g=0): rw=randrw, bs=(R) 4096B-4096B, (W) 4096B-4096B, (T) 4096B-4096B, ioengine=libaio, iodepth=32
...
fio-3.13-42-g8066f
Starting 4 processes

fast-raid10_rand75read: (groupid=0, jobs=4): err= 0: pid=27399: Mon May 27 18:40:29 2019
  read: IOPS=110k, BW=430MiB/s (451MB/s)(23.0GiB/57145msec)
   bw (  KiB/s): min=414080, max=620144, per=100.00%, avg=441721.99, stdev=7481.88, samples=451
   iops        : min=103520, max=155036, avg=110430.45, stdev=1870.47, samples=451
  write: IOPS=36.7k, BW=143MiB/s (150MB/s)(8198MiB/57145msec); 0 zone resets
   bw (  KiB/s): min=137224, max=206440, per=100.00%, avg=147385.78, stdev=2467.32, samples=451
   iops        : min=34306, max=51610, avg=36846.38, stdev=616.83, samples=451
  cpu          : usr=4.38%, sys=31.09%, ctx=4625955, majf=0, minf=37
  IO depths    : 1=0.1%, 2=0.1%, 4=0.1%, 8=0.1%, 16=0.1%, 32=100.0%, >=64=0.0%
     submit    : 0=0.0%, 4=100.0%, 8=0.0%, 16=0.0%, 32=0.0%, 64=0.0%, >=64=0.0%
     complete  : 0=0.0%, 4=100.0%, 8=0.0%, 16=0.0%, 32=0.1%, 64=0.0%, >=64=0.0%
     issued rwts: total=6290017,2098591,0,0 short=0,0,0,0 dropped=0,0,0,0
     latency   : target=0, window=0, percentile=100.00%, depth=32

Run status group 0 (all jobs):
   READ: bw=430MiB/s (451MB/s), 430MiB/s-430MiB/s (451MB/s-451MB/s), io=23.0GiB (25.8GB), run=57145-57145msec
  WRITE: bw=143MiB/s (150MB/s), 143MiB/s-143MiB/s (150MB/s-150MB/s), io=8198MiB (8596MB), run=57145-57145msec

Disk stats (read/write):
    md5: ios=6289620/2098512, merge=0/0, ticks=0/0, in_queue=0, util=0.00%, aggrios=3144679/2098476, aggrmerge=329/162, aggrticks=901109/410843, aggrin_queue=980248, aggrutil=100.00%
  nvme0n1: ios=3177529/2098621, merge=0/12, ticks=301788/24926, in_queue=373208, util=100.00%
  sdc: ios=3111830/2098332, merge=658/313, ticks=1500430/796760, in_queue=1587288, util=100.00%
slow-raid1_rand75read: (g=0): rw=randrw, bs=(R) 4096B-4096B, (W) 4096B-4096B, (T) 4096B-4096B, ioengine=libaio, iodepth=32
...
fio-3.13-42-g8066f
Starting 4 processes

slow-raid1_rand75read: (groupid=0, jobs=4): err= 0: pid=27428: Mon May 27 19:40:34 2019
  read: IOPS=84, BW=337KiB/s (346kB/s)(1188MiB/3604229msec)
   bw (  KiB/s): min=   28, max= 2486, per=100.00%, avg=540.41, stdev=119.45, samples=17980
   iops        : min=    4, max=  621, avg=134.68, stdev=29.86, samples=17980
  write: IOPS=28, BW=113KiB/s (116kB/s)(398MiB/3604229msec); 0 zone resets
   bw (  KiB/s): min=   28, max= 1087, per=100.00%, avg=215.17, stdev=45.43, samples=15087
   iops        : min=    4, max=  271, avg=53.36, stdev=11.36, samples=15087
  cpu          : usr=0.01%, sys=0.08%, ctx=213113, majf=0, minf=34
  IO depths    : 1=0.1%, 2=0.1%, 4=0.1%, 8=0.1%, 16=0.1%, 32=100.0%, >=64=0.0%
     submit    : 0=0.0%, 4=100.0%, 8=0.0%, 16=0.0%, 32=0.0%, 64=0.0%, >=64=0.0%
     complete  : 0=0.0%, 4=100.0%, 8=0.0%, 16=0.0%, 32=0.1%, 64=0.0%, >=64=0.0%
     issued rwts: total=304053,101763,0,0 short=0,0,0,0 dropped=0,0,0,0
     latency   : target=0, window=0, percentile=100.00%, depth=32

Run status group 0 (all jobs):
   READ: bw=337KiB/s (346kB/s), 337KiB/s-337KiB/s (346kB/s-346kB/s), io=1188MiB (1245MB), run=3604229-3604229msec
  WRITE: bw=113KiB/s (116kB/s), 113KiB/s-113KiB/s (116kB/s-116kB/s), io=398MiB (417MB), run=3604229-3604229msec

Disk stats (read/write):
    md6: ios=304053/103780, merge=0/0, ticks=0/0, in_queue=0, util=0.00%, aggrios=152025/103790, aggrmerge=1/663, aggrticks=50772659/28311543, aggrin_queue=23973600, aggrutil=53.64%
  sde: ios=143654/103782, merge=2/671, ticks=17259120/5776421, in_queue=12313572, util=23.68%
  sdd: ios=160396/103798, merge=1/655, ticks=84286199/50846665, in_queue=35633628, util=53.64%
slow-raid10_rand75read: (g=0): rw=randrw, bs=(R) 4096B-4096B, (W) 4096B-4096B, (T) 4096B-4096B, ioengine=libaio, iodepth=32
...
fio-3.13-42-g8066f
Starting 4 processes

slow-raid10_rand75read: (groupid=0, jobs=4): err= 0: pid=28197: Mon May 27 20:40:45 2019
  read: IOPS=81, BW=328KiB/s (336kB/s)(1156MiB/3610270msec)
   bw (  KiB/s): min=   28, max= 2568, per=100.00%, avg=508.77, stdev=109.01, samples=18593
   iops        : min=    4, max=  642, avg=127.05, stdev=27.25, samples=18593
  write: IOPS=27, BW=110KiB/s (112kB/s)(386MiB/3610270msec); 0 zone resets
   bw (  KiB/s): min=   28, max= 1048, per=100.00%, avg=200.66, stdev=41.08, samples=15746
   iops        : min=    4, max=  262, avg=50.02, stdev=10.27, samples=15746
  cpu          : usr=0.01%, sys=0.07%, ctx=208409, majf=0, minf=37
  IO depths    : 1=0.1%, 2=0.1%, 4=0.1%, 8=0.1%, 16=0.1%, 32=100.0%, >=64=0.0%
     submit    : 0=0.0%, 4=100.0%, 8=0.0%, 16=0.0%, 32=0.0%, 64=0.0%, >=64=0.0%
     complete  : 0=0.0%, 4=100.0%, 8=0.0%, 16=0.0%, 32=0.1%, 64=0.0%, >=64=0.0%
     issued rwts: total=295820,98860,0,0 short=0,0,0,0 dropped=0,0,0,0
     latency   : target=0, window=0, percentile=100.00%, depth=32

Run status group 0 (all jobs):
   READ: bw=328KiB/s (336kB/s), 328KiB/s-328KiB/s (336kB/s-336kB/s), io=1156MiB (1212MB), run=3610270-3610270msec
  WRITE: bw=110KiB/s (112kB/s), 110KiB/s-110KiB/s (112kB/s-112kB/s), io=386MiB (405MB), run=3610270-3610270msec

Disk stats (read/write):
    md7: ios=295820/100895, merge=0/0, ticks=0/0, in_queue=0, util=0.00%, aggrios=147908/100940, aggrmerge=1/642, aggrticks=51356785/29919840, aggrin_queue=24559964, aggrutil=53.42%
  sde: ios=137873/100905, merge=2/677, ticks=26306419/13385259, in_queue=14197356, util=28.45%
sdd: ios=157944/100976, merge=1/607, ticks=76407151/46454421, in_queue=34922572, util=53.42% |
3 thoughts on “Linux RAID-10 may not always be the best performer, but I don’t know why”