Experiments with RDRAND and EntropyKey

Entropy, when the shannons are gone and you can’t go on ^

The new release of Debian 10 (buster) brings with it some significant things related to entropy:

  1. systemd doesn’t trust entropy saved at last boot
  2. Many system daemons now use getrandom() which requires the CRNG be primed with good entropy
  3. The kernel by default trusts the CPU’s RDRAND instruction if it’s available

A lot of machines — especially virtual machines — don’t have access to a lot of entropy when they start up, and now that systemd isn’t accrediting stored entropy from the previous boot some essential services like ssh may take minutes to start up.

Back in 2011 or so, Intel added a CPU instruction called RDRAND which provides entropy, but there was some concern that it was an unauditable feature that could easily have been compromised, so it never did get used as the sole source of entropy on capable CPUs.

Later on, an option to trust the CPU for providing boot-time entropy was added, and this option was enabled by default in Debian kernels from 10.0 onwards.

I am okay with using RDRAND for boot-time entropy, but some people got very upset about it.

Out of interest I had a look at what effect the various kernel options related to RDRAND would have, and also what about when I use BitFolk’s entropy service.

(As of July 2019 this wiki article is in dire need of rewrite since I believe it states some untrue things about urandom, but the details of what the entropy service is and how to use it are correct)

Experiments ^

These experiments were carried out on a virtual machine which is a default install of Debian 10 (buster) on BitFolk. At package selection only “Standard system utilities” and “SSH server” were selected.

Default boot ^

SSH is available just over 1 second after boot.

[    1.072760] random: get_random_bytes called from start_kernel+0x93/0x52c with crng_init=0
[    1.138541] random: crng done (trusting CPU's manufacturer)

Don’t trust RDRAND for early entropy ^

If I tell the kernel not to trust RDRAND for early entropy by using random.trust_cpu=off on the kernel command line then SSH is available after about 4.5 seconds.

[    1.115416] random: get_random_bytes called from start_kernel+0x93/0x52c with crng_init=0
[    1.231606] random: fast init done
[    4.260130] random: systemd-random-: uninitialized urandom read (512 bytes read)
[    4.484274] random: crng init done

Don’t use RDRAND at all ^

If I completely disable the kernel’s use of RDRAND by using nordrand on the kernel command line then SSH is available after just under 49 seconds.

[    1.110475] random: get_random_bytes called from start_kernel+0x93/0x52c with crng_init=0
[    1.225991] random: fast init done
[    4.298185] random: systemd-random-: uninitialized urandom read (512 bytes read)
[    4.674676] random: dbus-daemon: uninitialized urandom read (12 bytes read)
[    4.682873] random: dbus-daemon: uninitialized urandom read (12 bytes read)
[   48.876084] random: crng init done

Use entropy service but not RDRAND ^

If I disable RDRAND but use BitFolk’s entropy service then SSH is available in just over 10 seconds. I suppose this is slower than with random.trust_cpu=off because in that case RDRAND is still allowed after initial seeding, and we must wait for a userland daemon to start.

Using the entropy service requires the network to be up so I’m not sure how easy it would be to decrease this delay, but 10 seconds is still a lot better than 49 seconds.

[    1.075910] random: get_random_bytes called from start_kernel+0x93/0x52c with crng_init=0
[    1.186650] random: fast init done
[    4.207010] random: systemd-random-: uninitialized urandom read (512 bytes read)
[    4.606789] random: dbus-daemon: uninitialized urandom read (12 bytes read)
[    4.613975] random: dbus-daemon: uninitialized urandom read (12 bytes read)
[   10.257513] random: crng init done

Use entropy service but don’t trust CPU for early seeding ^

This was no different to just random.trust_cpu=off (about 4.5s). I suspect because early seeding completed and then RDRAND supplied more entropy before the network came up and the entropy service daemon could start.

Thoughts ^

I’m glad that my CPUs have RDRAND and I’m prepared to use it for boot-time seeding of the CSPRNG, but not as the machines’ sole entropy source.

With RDRAND available, using the BitFolk entropy service probably doesn’t make that much sense as RDRAND will always be able to supply.

More paranoid customers may want to use random.trust_cpu=off but even then probably don’t need the entropy service since once the CSPRNG is seeded, RDRAND can be mixed in and away they go.

The truly paranoid may want to disable RDRAND in which case using the entropy service would be recommended since otherwise long delays at boot will happen and severe delays during times of high entropy demand could be seen.

For those who aren’t BitFolk customers and don’t have access to hardware entropy sources and don’t have a CPU with RDRAND support there are some tough choices. Every other option listed on Debian’s relevant wiki article has at least one expert who says it’s a bad choice.

Linux RAID-10 fixed on imbalanced devices?

Recap ^

In a previous article I demonstrated that Linux RAID-10 lacked an optimisation for non-rotational devices that was present in RAID-1.

In the case of imbalanced devices such as my system with one SATA SSD and one PCI NVMe, this could cause RAID-10 to perform 3 times worse than RAID-1 at random reads.

A possible fix ^

Kernel developer Guoqing Jiang contacted me to provide a patch to add the same optimisation that is present in RAID-1 to RAID-10.

Updated performance figures ^

I’ve applied Guoqing’s patch and re-run the tests for the RAID-10 targets. Figures for other targets are from the pervious post for comparison.

Sequential IO ^

Test Throughput (MiB/s)
Fast RAID-1 Fast RAID-10 Fast RAID-10 (patched) Slow RAID-1 Slow RAID-10 Slow RAID-10 (patched)
Read 1,237 1,682 2,141 198 188 211
Write 321 321 321 18 19 19

The patched RAID-10 is the clear winner for sequential IO. It even peforms about 27% faster than the unpacthed variant.

Random IO ^

Test IOPS
Fast RAID-1 Fast RAID-10 Fast RAID-10 (patched) Slow RAID-1 Slow RAID-10 Slow RAID-10 (patched)
Random Read 602,000 208,000 602,000 501 501 487
Random Write 82,200 82,200 82,200 25 21 71

The patched RAID-10 is now indistinguishable from performance of RAID-1, almost 3 times faster than without the patch!

I am unable to explain why RAID-10 writes on the slow devices (HDDs) is so much better than before.

The patch ^

Guoqing Jiang’s patch is as follows in case anyone wants to test it. Guoqing has only compile-tested it as they don’t have the required hardware. I have tested it and it seems okay, but don’t use it on any data you care about yet.

diff --git a/drivers/md/raid10.c b/drivers/md/raid10.c
index 25e97de36717..2ebe49b18aeb 100644
--- a/drivers/md/raid10.c
+++ b/drivers/md/raid10.c
@@ -745,15 +745,19 @@ static struct md_rdev *read_balance(struct r10conf *conf,
        int sectors = r10_bio->sectors;
        int best_good_sectors;
        sector_t new_distance, best_dist;
-       struct md_rdev *best_rdev, *rdev = NULL;
+       struct md_rdev *best_dist_rdev, *best_pending_rdev, *rdev = NULL;
        int do_balance;
-       int best_slot;
+       int best_dist_slot, best_pending_slot;
+       int has_nonrot_disk = 0;
+       unsigned int min_pending;
        struct geom *geo = &conf->geo;
 
        raid10_find_phys(conf, r10_bio);
        rcu_read_lock();
-       best_slot = -1;
-       best_rdev = NULL;
+       best_dist_slot = -1;
+       min_pending = UINT_MAX;
+       best_dist_rdev = NULL;
+       best_pending_rdev = NULL;
        best_dist = MaxSector;
        best_good_sectors = 0;
        do_balance = 1;
@@ -775,6 +779,8 @@ static struct md_rdev *read_balance(struct r10conf *conf,
                sector_t first_bad;
                int bad_sectors;
                sector_t dev_sector;
+               unsigned int pending;
+               bool nonrot;
 
                if (r10_bio->devs[slot].bio == IO_BLOCKED)
                        continue;
@@ -811,8 +817,8 @@ static struct md_rdev *read_balance(struct r10conf *conf,
                                        first_bad - dev_sector;
                                if (good_sectors > best_good_sectors) {
                                        best_good_sectors = good_sectors;
-                                       best_slot = slot;
-                                       best_rdev = rdev;
+                                       best_dist_slot = slot;
+                                       best_dist_rdev = rdev;
                                }
                                if (!do_balance)
                                        /* Must read from here */
@@ -825,14 +831,23 @@ static struct md_rdev *read_balance(struct r10conf *conf,
                if (!do_balance)
                        break;
 
-               if (best_slot >= 0)
+               nonrot = blk_queue_nonrot(bdev_get_queue(rdev->bdev));
+               has_nonrot_disk |= nonrot;
+               pending = atomic_read(&rdev->nr_pending);
+               if (min_pending > pending && nonrot) {
+                       min_pending = pending;
+                       best_pending_slot = slot;
+                       best_pending_rdev = rdev;
+               }
+
+               if (best_dist_slot >= 0)
                        /* At least 2 disks to choose from so failfast is OK */
                        set_bit(R10BIO_FailFast, &r10_bio->state);
                /* This optimisation is debatable, and completely destroys
                 * sequential read speed for 'far copies' arrays.  So only
                 * keep it for 'near' arrays, and review those later.
                 */
-               if (geo->near_copies > 1 && !atomic_read(&rdev->nr_pending))
+               if (geo->near_copies > 1 && !pending)
                        new_distance = 0;
 
                /* for far > 1 always use the lowest address */
@@ -841,15 +856,21 @@ static struct md_rdev *read_balance(struct r10conf *conf,
                else
                        new_distance = abs(r10_bio->devs[slot].addr -
                                           conf->mirrors[disk].head_position);
+
                if (new_distance < best_dist) {
                        best_dist = new_distance;
-                       best_slot = slot;
-                       best_rdev = rdev;
+                       best_dist_slot = slot;
+                       best_dist_rdev = rdev;
                }
        }
        if (slot >= conf->copies) {
-               slot = best_slot;
-               rdev = best_rdev;
+               if (has_nonrot_disk) {
+                       slot = best_pending_slot;
+                       rdev = best_pending_rdev;
+               } else {
+                       slot = best_dist_slot;
+                       rdev = best_dist_rdev;
+               }
        }
 
        if (slot >= 0) {

Exploring different Linux RAID-10 layouts with unbalanced devices

Background ^

In a previous article I explored the performance of different Linux RAID configurations in a situation where there are two very mismatched devices.

The two devices are a Samsung SM883 SATA SSD and a Samsung PM983 NVMe. Both of these devices are very fast, but the NVMe can be 6 times faster than the SSD for random (4KiB) reads.

The previous article established that due to performance optimisations in Linux RAID-1 targeted at non-rotational devices like SSDs, RAID-1 outperforms RAID-10 by about 3x for random reads in this unbalanced setup.

RAID-10 Layouts ^

A respondent on the linux-raid list suggested I test out different RAID-10 layouts. The default RAID-10 layout on Linux corresponds to the standard and is called near. There are also two alternative layouts, far and offset. Wikipedia has a good article on the difference between these three layouts.

Charts ^

Click on the thumbnails to see full size images.

Sequential IO ^

Reads ^


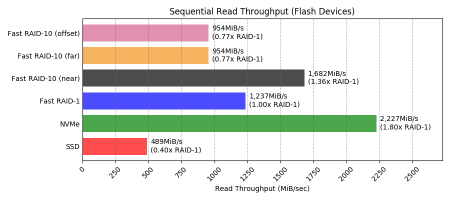
far and offset layouts perform the same: about twice the speed of a single SSD, but only ~57% of RAID-1 and interestingly only ~77% of RAID-10 near layout.

Writes ^


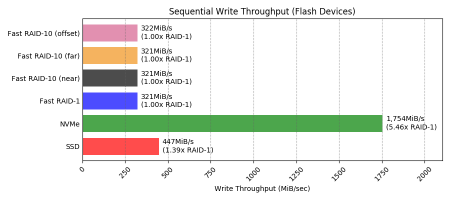
All layouts perform the same for sequential writes (the same as RAID-1).

Random IO ^

Reads ^


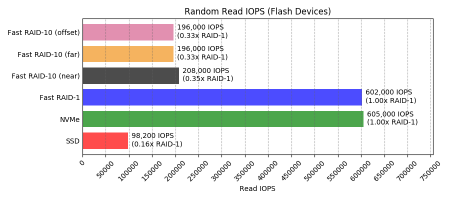
far and offset performed slightly worse than near (~94%) and still only about a third of RAID-1.

Writes ^


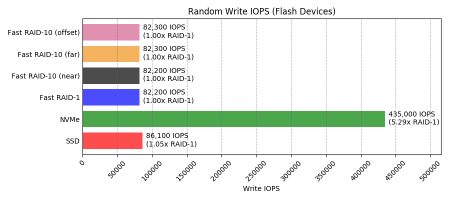
All layouts of RAID-10 perform the same as RAID-1 for random writes.

Data Tables ^

This is just the raw data for the charts above. Skip to the conclusions if you’re not interested in seeing the numbers for the things you already saw as pictures.

Sequential IO ^

Test Throughput (MiB/s)
SSD NVMe HDD Fast RAID-1 Fast RAID-10 (near) Fast RAID-10 (far) Fast RAID-10 (offset) Slow RAID-1 Slow RAID-10 (near)
Read 489 2,227 26 1,237 1,682 954 954 198 188
Write 447 1,754 20 321 321 321 322 18 19

Random IO ^

Test IOPS
SSD NVMe HDD Fast RAID-1 Fast RAID-10 (near) Fast RAID-10 (far) Fast RAID-10 (offset) Slow RAID-1 Slow RAID-10 (near)
Random Read 98,200 605,000 256 602,000 208,000 196,000 196,000 501 501
Random Write 86,100 435,000 74 82,200 82,200 82,300 82,300 25 21

Conclusions ^

I was not able to see any difference between the non-default Linux RAID-10 layouts for my devices and I think it’s likely this holds for all non-rotational devices in general.

far and offset layouts performed significantly worse than the default near layout for sequential read IO and no better than the default near layout in any other scenario.

Since layouts other than the default near restrict the reshaping options for RAID-10, I don’t recommend using them for RAID-10 composed entirely of non-rotational devices.

Additionally, if — as in my case — the devices have a big variance in performance compared to each other then it remains best to use RAID-1.

Appendix ^

Setup ^

I’ll only cover what has changed from the previous article.

Partitioning ^

I added two extra 10GiB partitions on each device; one for testing the far layout and the other for testing the offset layout.

$ sudo gdisk /dev/sdc                                                        
GPT fdisk (gdisk) version 1.0.3                                                                                                                                           
Partition table scan:                                                                
  MBR: protective                                                                   
  BSD: not present                                                                   
  APM: not present                                                                   
  GPT: present                                                                      
 
Found valid GPT with protective MBR; using GPT.                                     
 
Command (? for help): p                                                        
Disk /dev/sdc: 7501476528 sectors, 3.5 TiB                                           Model: SAMSUNG MZ7KH3T8                                            
Sector size (logical/physical): 512/4096 bytes                   
Disk identifier (GUID): 7D7DFDA2-502C-47FE-A437-5442CCCE7E6B
Partition table holds up to 128 entries                                              Main partition table begins at sector 2 and ends at sector 33                        
First usable sector is 34, last usable sector is 7501476494                         
Partitions will be aligned on 2048-sector boundaries                                
Total free space is 7438561901 sectors (3.5 TiB)                                                                                                                          
Number  Start (sector)    End (sector)  Size       Code  Name                        
   1            2048        20973567   10.0 GiB    8300  Linux filesystem          
   2        20973568        41945087   10.0 GiB    8300  Linux filesystem            
   3        41945088        62916607   10.0 GiB    8300  Linux filesystem
 
Command (? for help): n                  
Partition number (4-128, default 4):                                                
First sector (34-7501476494, default = 62916608) or {+-}size{KMGTP}:                 Last sector (62916608-7501476494, default = 7501476494) or {+-}size{KMGTP}: +10g     
Current type is 'Linux filesystem'                                                  
Hex code or GUID (L to show codes, Enter = 8300):                                   
Changed type of partition to 'Linux filesystem'                                      
 
Command (? for help): n                                                             
Partition number (5-128, default 5):                                                 
First sector (34-7501476494, default = 83888128) or {+-}size{KMGTP}:                
Last sector (83888128-7501476494, default = 7501476494) or {+-}size{KMGTP}: +10g     
Current type is 'Linux filesystem'                                             
Hex code or GUID (L to show codes, Enter = 8300):                                    Changed type of partition to 'Linux filesystem'                                
 
Command (? for help): w                                            
                                                                                     Final checks complete. About to write GPT data. THIS WILL OVERWRITE EXISTING        
PARTITIONS!!                                                                        
 
Do you want to proceed? (Y/N): y                                                     
OK; writing new GUID partition table (GPT) to /dev/sdc.                             
Warning: The kernel is still using the old partition table.                          The new table will be used at the next reboot or after you                           
run partprobe(8) or kpartx(8)                                                        
The operation has completed successfully.                                            
$ sudo gdisk /dev/nvme0n1                                                            
GPT fdisk (gdisk) version 1.0.3                                                   
 
Partition table scan:                                                                
  MBR: protective                                                              
  BSD: not present                                                             
  APM: not present                                                                   
  GPT: present                                                                
 
Found valid GPT with protective MBR; using GPT.                                     
 
Command (? for help): p                                                          
Disk /dev/nvme0n1: 7501476528 sectors, 3.5 TiB                        
Model: SAMSUNG MZQLB3T8HALS-00007                                                
Sector size (logical/physical): 512/512 bytes                                        
Disk identifier (GUID): C6F311B7-BE47-47C1-A1CB-F0A6D8C13136                        
Partition table holds up to 128 entries                                           
Main partition table begins at sector 2 and ends at sector 33                     
First usable sector is 34, last usable sector is 7501476494                          
Partitions will be aligned on 2048-sector boundaries                          
Total free space is 7438561901 sectors (3.5 TiB)                                   
 
Number  Start (sector)    End (sector)  Size       Code  Name                        
   1            2048        20973567   10.0 GiB    8300  Linux filesystem
   2        20973568        41945087   10.0 GiB    8300  Linux filesystem
   3        41945088        62916607   10.0 GiB    8300  Linux filesystem
 
Command (? for help): n
Partition number (4-128, default 4):
First sector (34-7501476494, default = 62916608) or {+-}size{KMGTP}:
Last sector (62916608-7501476494, default = 7501476494) or {+-}size{KMGTP}: +10g
Current type is 'Linux filesystem'
Hex code or GUID (L to show codes, Enter = 8300):
Changed type of partition to 'Linux filesystem'
 
Command (? for help): n
Partition number (5-128, default 5):
First sector (34-7501476494, default = 83888128) or {+-}size{KMGTP}:
Last sector (83888128-7501476494, default = 7501476494) or {+-}size{KMGTP}: +10g
Current type is 'Linux filesystem'
Hex code or GUID (L to show codes, Enter = 8300):
Changed type of partition to 'Linux filesystem'
 
Command (? for help): w
 
Final checks complete. About to write GPT data. THIS WILL OVERWRITE EXISTING
PARTITIONS!!
 
Do you want to proceed? (Y/N): y
OK; writing new GUID partition table (GPT) to /dev/nvme0n1.
Warning: The kernel is still using the old partition table.
The new table will be used at the next reboot or after you
run partprobe(8) or kpartx(8)
The operation has completed successfully.
$ sudo partprobe /dev/sdc
$ sudo partprobe /dev/nvme0n1

Array creation ^

$ sudo mdadm --create \
  --verbose \
  --assume-clean \
  /dev/md8 \
  --level=10 \
  --raid-devices=2 \
  --layout=f2 \
  /dev/sdc4 /dev/nvme0n1p4
mdadm: chunk size defaults to 512K
mdadm: size set to 10476544K
mdadm: Defaulting to version 1.2 metadata
mdadm: array /dev/md8 started.
$ sudo mdadm --create \
  --verbose \
  --assume-clean \
  /dev/md9 \
  --level=10 \
  --raid-devices=2 \
  --layout=o2 \
  /dev/sdc5 /dev/nvme0n1p5
mdadm: chunk size defaults to 512K
mdadm: size set to 10476544K
mdadm: Defaulting to version 1.2 metadata
mdadm: array /dev/md9 started.
$ cat /proc/mdstat
Personalities : [linear] [multipath] [raid0] [raid1] [raid10] [raid6] [raid5] [raid4]
 
md9 : active raid10 nvme0n1p5[1] sdc5[0]
      10476544 blocks super 1.2 512K chunks 2 offset-copies [2/2] [UU]
 
md8 : active raid10 nvme0n1p4[1] sdc4[0]
      10476544 blocks super 1.2 512K chunks 2 far-copies [2/2] [UU]
 
md7 : active raid10 sde3[1] sdd3[0]
      10476544 blocks super 1.2 2 near-copies [2/2] [UU]
 
md6 : active raid1 sde2[1] sdd2[0]
      10476544 blocks super 1.2 [2/2] [UU]
 
md5 : active raid10 nvme0n1p3[1] sdc3[0]
      10476544 blocks super 1.2 2 near-copies [2/2] [UU]
 
md4 : active raid1 nvme0n1p2[1] sdc2[0]
      10476544 blocks super 1.2 [2/2] [UU]
 
md2 : active (auto-read-only) raid10 sda3[0] sdb3[1]
      974848 blocks super 1.2 2 near-copies [2/2] [UU]
 
md0 : active raid1 sdb1[1] sda1[0]
      497664 blocks super 1.2 [2/2] [UU]
 
md1 : active raid10 sda2[0] sdb2[1]
      1950720 blocks super 1.2 2 near-copies [2/2] [UU]
 
md3 : active raid10 sda5[0] sdb5[1]
      12025856 blocks super 1.2 2 near-copies [2/2] [UU]
 
unused devices: <none>

Raw fio Output ^

Only output from the tests on the arrays with non-default output is shown here; the rest is in the previous article.

This is a lot of output and it’s the last thing in this article, so if you’re not interested in it you should stop reading now.

fast-raid10-f2_seqread: (g=0): rw=read, bs=(R) 4096B-4096B, (W) 4096B-4096B[175/9131]
B-4096B, ioengine=libaio, iodepth=32
...
fio-3.13-42-g8066f
Starting 4 processes
fast-raid10-f2_seqread: Laying out IO file (1 file / 8192MiB)
 
fast-raid10-f2_seqread: (groupid=0, jobs=4): err= 0: pid=5287: Sun Jun  2 00:18:35 20
19
  read: IOPS=244k, BW=954MiB/s (1001MB/s)(32.0GiB/34340msec)
   bw (  KiB/s): min=968176, max=984312, per=100.00%, avg=977239.00, stdev=740.55, sa
mples=272
   iops        : min=242044, max=246078, avg=244309.69, stdev=185.14, samples=272
  cpu          : usr=6.98%, sys=33.05%, ctx=738159, majf=0, minf=167
  IO depths    : 1=0.1%, 2=0.1%, 4=0.1%, 8=0.1%, 16=0.1%, 32=100.0%, >=64=0.0%
     submit    : 0=0.0%, 4=100.0%, 8=0.0%, 16=0.0%, 32=0.0%, 64=0.0%, >=64=0.0%
     complete  : 0=0.0%, 4=100.0%, 8=0.0%, 16=0.0%, 32=0.1%, 64=0.0%, >=64=0.0%
     issued rwts: total=8388608,0,0,0 short=0,0,0,0 dropped=0,0,0,0
     latency   : target=0, window=0, percentile=100.00%, depth=32
 
Run status group 0 (all jobs):
   READ: bw=954MiB/s (1001MB/s), 954MiB/s-954MiB/s (1001MB/s-1001MB/s), io=32.0GiB (3
4.4GB), run=34340-34340msec
 
Disk stats (read/write):
    md8: ios=8379702/75, merge=0/0, ticks=0/0, in_queue=0, util=0.00%, aggrios=276780
2/15, aggrmerge=1426480/64, aggrticks=618421/9, aggrin_queue=604770, aggrutil=99.93%
  nvme0n1: ios=4194304/15, merge=0/64, ticks=154683/0, in_queue=160368, util=99.93%
  sdc: ios=1341300/16, merge=2852961/64, ticks=1082160/19, in_queue=1049172, util=99.
81%
fast-raid10-o2_seqread: (g=0): rw=read, bs=(R) 4096B-4096B, (W) 4096B-4096B, (T) 4096
B-4096B, ioengine=libaio, iodepth=32
...
fio-3.13-42-g8066f
Starting 4 processes
fast-raid10-o2_seqread: Laying out IO file (1 file / 8192MiB)
 
fast-raid10-o2_seqread: (groupid=0, jobs=4): err= 0: pid=5312: Sun Jun  2 00:19:31 20
19
  read: IOPS=244k, BW=954MiB/s (1000MB/s)(32.0GiB/34358msec)
   bw (  KiB/s): min=969458, max=981640, per=100.00%, avg=976601.62, stdev=607.72, sa
mples=272
   iops        : min=242364, max=245410, avg=244150.46, stdev=151.95, samples=272
  cpu          : usr=5.91%, sys=33.95%, ctx=732590, majf=0, minf=162
  IO depths    : 1=0.1%, 2=0.1%, 4=0.1%, 8=0.1%, 16=0.1%, 32=100.0%, >=64=0.0%
     submit    : 0=0.0%, 4=100.0%, 8=0.0%, 16=0.0%, 32=0.0%, 64=0.0%, >=64=0.0%
     complete  : 0=0.0%, 4=100.0%, 8=0.0%, 16=0.0%, 32=0.1%, 64=0.0%, >=64=0.0%
     issued rwts: total=8388608,0,0,0 short=0,0,0,0 dropped=0,0,0,0
     latency   : target=0, window=0, percentile=100.00%, depth=32
 
Run status group 0 (all jobs):
   READ: bw=954MiB/s (1000MB/s), 954MiB/s-954MiB/s (1000MB/s-1000MB/s), io=32.0GiB (3
4.4GB), run=34358-34358msec
 
Disk stats (read/write):
    md9: ios=8385126/75, merge=0/0, ticks=0/0, in_queue=0, util=0.00%, aggrios=276691
0/15, aggrmerge=1427340/64, aggrticks=618657/10, aggrin_queue=606194, aggrutil=99.99%
  nvme0n1: ios=4194304/15, merge=0/64, ticks=157297/1, in_queue=163632, util=99.94%
  sdc: ios=1339516/16, merge=2854681/64, ticks=1080017/19, in_queue=1048756, util=99.
99%
fast-raid10-f2_seqwrite: (g=0): rw=write, bs=(R) 4096B-4096B, (W) 4096B-4096B, (T) 40
96B-4096B, ioengine=libaio, iodepth=32
...
fio-3.13-42-g8066f
Starting 4 processes
 
fast-raid10-f2_seqwrite: (groupid=0, jobs=4): err= 0: pid=5337: Sun Jun  2 00:21:13 2
019
  write: IOPS=82.2k, BW=321MiB/s (337MB/s)(32.0GiB/101992msec); 0 zone resets
   bw (  KiB/s): min=315288, max=336184, per=99.99%, avg=328946.06, stdev=670.42, sam
ples=812
   iops        : min=78822, max=84046, avg=82236.45, stdev=167.60, samples=812
  cpu          : usr=2.15%, sys=34.88%, ctx=973042, majf=0, minf=38
  IO depths    : 1=0.1%, 2=0.1%, 4=0.1%, 8=0.1%, 16=0.1%, 32=100.0%, >=64=0.0%
     submit    : 0=0.0%, 4=100.0%, 8=0.0%, 16=0.0%, 32=0.0%, 64=0.0%, >=64=0.0%
     complete  : 0=0.0%, 4=100.0%, 8=0.0%, 16=0.0%, 32=0.1%, 64=0.0%, >=64=0.0%
     issued rwts: total=0,8388608,0,0 short=0,0,0,0 dropped=0,0,0,0
     latency   : target=0, window=0, percentile=100.00%, depth=32
 
Run status group 0 (all jobs):
  WRITE: bw=321MiB/s (337MB/s), 321MiB/s-321MiB/s (337MB/s-337MB/s), io=32.0GiB (34.4
GB), run=101992-101992msec
 
Disk stats (read/write):                                                    [92/9131]
    md8: ios=0/8380840, merge=0/0, ticks=0/0, in_queue=0, util=0.00%, aggrios=0/83882
06, aggrmerge=0/461, aggrticks=0/704880, aggrin_queue=724510, aggrutil=100.00%
  nvme0n1: ios=0/8388649, merge=0/20, ticks=0/123227, in_queue=202792, util=100.00%
  sdc: ios=0/8387763, merge=0/902, ticks=0/1286533, in_queue=1246228, util=98.78%
fast-raid10-o2_seqwrite: (g=0): rw=write, bs=(R) 4096B-4096B, (W) 4096B-4096B, (T) 40
96B-4096B, ioengine=libaio, iodepth=32
...
fio-3.13-42-g8066f
Starting 4 processes
 
fast-raid10-o2_seqwrite: (groupid=0, jobs=4): err= 0: pid=5366: Sun Jun  2 00:22:56 2
019
  write: IOPS=82.4k, BW=322MiB/s (337MB/s)(32.0GiB/101820msec); 0 zone resets
   bw (  KiB/s): min=316248, max=420304, per=100.00%, avg=331319.30, stdev=3808.39, s
amples=807
   iops        : min=79062, max=105076, avg=82829.76, stdev=952.10, samples=807
  cpu          : usr=2.19%, sys=34.22%, ctx=975496, majf=0, minf=37
  IO depths    : 1=0.1%, 2=0.1%, 4=0.1%, 8=0.1%, 16=0.1%, 32=100.0%, >=64=0.0%
     submit    : 0=0.0%, 4=100.0%, 8=0.0%, 16=0.0%, 32=0.0%, 64=0.0%, >=64=0.0%
     complete  : 0=0.0%, 4=100.0%, 8=0.0%, 16=0.0%, 32=0.1%, 64=0.0%, >=64=0.0%
     issued rwts: total=0,8388608,0,0 short=0,0,0,0 dropped=0,0,0,0
     latency   : target=0, window=0, percentile=100.00%, depth=32
 
Run status group 0 (all jobs):
  WRITE: bw=322MiB/s (337MB/s), 322MiB/s-322MiB/s (337MB/s-337MB/s), io=32.0GiB (34.4
GB), run=101820-101820msec
 
Disk stats (read/write):
    md9: ios=0/8374085, merge=0/0, ticks=0/0, in_queue=0, util=0.00%, aggrios=0/83882
42, aggrmerge=0/442, aggrticks=0/704724, aggrin_queue=728030, aggrutil=100.00%
  nvme0n1: ios=0/8388657, merge=0/21, ticks=0/124463, in_queue=211316, util=100.00%
  sdc: ios=0/8387828, merge=0/864, ticks=0/1284985, in_queue=1244744, util=98.83%
fast-raid10-f2_randread: (g=0): rw=randread, bs=(R) 4096B-4096B, (W) 4096B-4096B, (T)
 4096B-4096B, ioengine=libaio, iodepth=32
...
fio-3.13-42-g8066f
Starting 4 processes
 
fast-raid10-f2_randread: (groupid=0, jobs=4): err= 0: pid=5412: Sun Jun  2 00:23:39 2
019
  read: IOPS=196k, BW=767MiB/s (804MB/s)(32.0GiB/42725msec)
   bw (  KiB/s): min=753863, max=816072, per=99.95%, avg=784998.94, stdev=3053.58, sa
mples=340
   iops        : min=188465, max=204018, avg=196249.72, stdev=763.40, samples=340
  cpu          : usr=4.97%, sys=25.34%, ctx=884047, majf=0, minf=161
  IO depths    : 1=0.1%, 2=0.1%, 4=0.1%, 8=0.1%, 16=0.1%, 32=100.0%, >=64=0.0%
     submit    : 0=0.0%, 4=100.0%, 8=0.0%, 16=0.0%, 32=0.0%, 64=0.0%, >=64=0.0%
     complete  : 0=0.0%, 4=100.0%, 8=0.0%, 16=0.0%, 32=0.1%, 64=0.0%, >=64=0.0%
     issued rwts: total=8388608,0,0,0 short=0,0,0,0 dropped=0,0,0,0
     latency   : target=0, window=0, percentile=100.00%, depth=32
 
Run status group 0 (all jobs):
   READ: bw=767MiB/s (804MB/s), 767MiB/s-767MiB/s (804MB/s-804MB/s), io=32.0GiB (34.4
GB), run=42725-42725msec
 
Disk stats (read/write):
    md8: ios=8371889/4, merge=0/0, ticks=0/0, in_queue=0, util=0.00%, aggrios=4191336
/15, aggrmerge=2963/1, aggrticks=1470317/6, aggrin_queue=854184, aggrutil=100.00%
  nvme0n1: ios=4194304/15, merge=0/1, ticks=317755/0, in_queue=338708, util=100.00%
  sdc: ios=4188368/16, merge=5926/2, ticks=2622880/12, in_queue=1369660, util=99.90%
fast-raid10-o2_randread: (g=0): rw=randread, bs=(R) 4096B-4096B, (W) 4096B-4096B, (T)
 4096B-4096B, ioengine=libaio, iodepth=32
...
fio-3.13-42-g8066f
Starting 4 processes
 
fast-raid10-o2_randread: (groupid=0, jobs=4): err= 0: pid=5437: Sun Jun  2 00:24:22 2
019
  read: IOPS=196k, BW=767MiB/s (804MB/s)(32.0GiB/42725msec)
   bw (  KiB/s): min=741672, max=832016, per=99.96%, avg=785051.96, stdev=4207.46, sa
mples=340
   iops        : min=185418, max=208004, avg=196262.98, stdev=1051.86, samples=340
  cpu          : usr=4.51%, sys=25.36%, ctx=886783, majf=0, minf=164
  IO depths    : 1=0.1%, 2=0.1%, 4=0.1%, 8=0.1%, 16=0.1%, 32=100.0%, >=64=0.0%
     submit    : 0=0.0%, 4=100.0%, 8=0.0%, 16=0.0%, 32=0.0%, 64=0.0%, >=64=0.0%
     complete  : 0=0.0%, 4=100.0%, 8=0.0%, 16=0.0%, 32=0.1%, 64=0.0%, >=64=0.0%
     issued rwts: total=8388608,0,0,0 short=0,0,0,0 dropped=0,0,0,0
     latency   : target=0, window=0, percentile=100.00%, depth=32
 
Run status group 0 (all jobs):
   READ: bw=767MiB/s (804MB/s), 767MiB/s-767MiB/s (804MB/s-804MB/s), io=32.0GiB (34.4
GB), run=42725-42725msec
 
Disk stats (read/write):                                                     [8/9131]
    md9: ios=8371755/4, merge=0/0, ticks=0/0, in_queue=0, util=0.00%, aggrios=4191564
/7, aggrmerge=2733/1, aggrticks=1469572/3, aggrin_queue=853154, aggrutil=100.00%
  nvme0n1: ios=4194304/7, merge=0/1, ticks=317525/0, in_queue=336088, util=100.00%
  sdc: ios=4188825/8, merge=5466/1, ticks=2621620/6, in_queue=1370220, util=99.87%
fast-raid10-f2_randwrite: (g=0): rw=randwrite, bs=(R) 4096B-4096B, (W) 4096B-4096B, (
T) 4096B-4096B, ioengine=libaio, iodepth=32
...
fio-3.13-42-g8066f
Starting 4 processes
 
fast-raid10-f2_randwrite: (groupid=0, jobs=4): err= 0: pid=5462: Sun Jun  2 00:26:04
2019
  write: IOPS=82.3k, BW=321MiB/s (337MB/s)(32.0GiB/101961msec); 0 zone resets
   bw (  KiB/s): min=318832, max=396249, per=100.00%, avg=329384.74, stdev=1762.35, s
amples=810
   iops        : min=79708, max=99061, avg=82346.02, stdev=440.57, samples=810
  cpu          : usr=2.42%, sys=34.38%, ctx=975633, majf=0, minf=39
  IO depths    : 1=0.1%, 2=0.1%, 4=0.1%, 8=0.1%, 16=0.1%, 32=100.0%, >=64=0.0%
     submit    : 0=0.0%, 4=100.0%, 8=0.0%, 16=0.0%, 32=0.0%, 64=0.0%, >=64=0.0%
     complete  : 0=0.0%, 4=100.0%, 8=0.0%, 16=0.0%, 32=0.1%, 64=0.0%, >=64=0.0%
     issued rwts: total=0,8388608,0,0 short=0,0,0,0 dropped=0,0,0,0
     latency   : target=0, window=0, percentile=100.00%, depth=32
 
Run status group 0 (all jobs):
  WRITE: bw=321MiB/s (337MB/s), 321MiB/s-321MiB/s (337MB/s-337MB/s), io=32.0GiB (34.4
GB), run=101961-101961msec
 
Disk stats (read/write):
    md8: ios=0/8383420, merge=0/0, ticks=0/0, in_queue=0, util=0.00%, aggrios=0/83886
62, aggrmerge=0/17, aggrticks=0/704633, aggrin_queue=735234, aggrutil=100.00%
  nvme0n1: ios=0/8388655, merge=0/14, ticks=0/123197, in_queue=208804, util=100.00%
  sdc: ios=0/8388669, merge=0/20, ticks=0/1286069, in_queue=1261664, util=98.75%
fast-raid10-o2_randwrite: (g=0): rw=randwrite, bs=(R) 4096B-4096B, (W) 4096B-4096B, (
T) 4096B-4096B, ioengine=libaio, iodepth=32
...
fio-3.13-42-g8066f
Starting 4 processes
 
fast-raid10-o2_randwrite: (groupid=0, jobs=4): err= 0: pid=5491: Sun Jun  2 00:27:47
2019
  write: IOPS=82.3k, BW=322MiB/s (337MB/s)(32.0GiB/101880msec); 0 zone resets
   bw (  KiB/s): min=315369, max=418520, per=100.00%, avg=330793.95, stdev=3466.64, s
amples=808
   iops        : min=78842, max=104630, avg=82698.46, stdev=866.66, samples=808
  cpu          : usr=2.21%, sys=34.38%, ctx=972875, majf=0, minf=39
  IO depths    : 1=0.1%, 2=0.1%, 4=0.1%, 8=0.1%, 16=0.1%, 32=100.0%, >=64=0.0%
     submit    : 0=0.0%, 4=100.0%, 8=0.0%, 16=0.0%, 32=0.0%, 64=0.0%, >=64=0.0%
     complete  : 0=0.0%, 4=100.0%, 8=0.0%, 16=0.0%, 32=0.1%, 64=0.0%, >=64=0.0%
     issued rwts: total=0,8388608,0,0 short=0,0,0,0 dropped=0,0,0,0
     latency   : target=0, window=0, percentile=100.00%, depth=32
 
Run status group 0 (all jobs):
  WRITE: bw=322MiB/s (337MB/s), 322MiB/s-322MiB/s (337MB/s-337MB/s), io=32.0GiB (34.4
GB), run=101880-101880msec
 
Disk stats (read/write):
    md9: ios=0/8368626, merge=0/0, ticks=0/0, in_queue=0, util=0.00%, aggrios=0/83886
67, aggrmerge=0/20, aggrticks=0/705086, aggrin_queue=732522, aggrutil=100.00%
  nvme0n1: ios=0/8388658, merge=0/19, ticks=0/123370, in_queue=209792, util=100.00%
  sdc: ios=0/8388677, merge=0/21, ticks=0/1286802, in_queue=1255252, util=98.95%

Why Linux RAID-10 sometimes performs worse than RAID-1

Background ^

In the previous article, “Linux RAID-10 may not always be the best performer, but I don’t know why“, we discovered that a RAID-10 of two mismatched drives can perform 3 times worse at random reads than a RAID-1 of the same devices.

In my case the two devices were a Samsung PM983 NVMe and a Samsung SM883 SATA SSD. The NVMe is about 6 times faster than the SSD at random reads.

An explanation ^

I posted about my findings on the linux-raid mailing list and got a very helpful reply from Guoqing Jiang.

It seems that RAID-1 has an enhancement for non-rotational devices such that it will direct IO to the least-loaded device.

For rotational devices, the distance between the location of the sectors is more important than which device is least loaded, because switching spindles has a big penalty in seeking to the correct location.

This is not so for non-rotational devices like SSD and NVMe, so if a non-rotational and lightly loaded device is available, it is selected for IO. That is why with RAID-1 I saw most of the IOs going to the fast NVME device with a corresponding boost in performance compared to RAID-10.

(click for larger)

The same enhancement has not been made for RAID-10. I do not know if this is just because no one got around to it yet, or if it’s because it may be technically harder (or impossible).

Linux RAID-10 may not always be the best performer, but I don’t know why

Background to the mystery ^

I have a server that has an SSD and an NVMe device which I intend to put into a two device RAID array. Since these devices have dramatically different performance characteristsics I did some basic tests to see which configuration would be best.

I’ve noticed that Linux’s MD RAID-10 sometimes performs much worse than MD RAID-1. This does not make much sense to me and I wondered why.

Update: the answer seems to have been found.

I’ve done some more tests and also included testing against some regular rotational HDDs just for comparison, even though I don’t intend to use them in the same way as the flash devices.

Results ^

Visuals first; testing details later. Some brief explanation of terms though.

Fast RAID
A RAID array composed of the two flash devices. One of them is an SSD and the other is an NVMe. While both of these devices are much much faster than HDDs, NVMe is again much faster than SSD so this is an imbalanced array.
Slow RAID
A RAID array composed of the two 5.4kRPM SATA HDDs. This is just for comparison. They are really, painfully, laughably slow compared to flash devices.

Charts ^

Click on the thumbnails to get a full size image. If you’re impatient, skip to the interesting bit.

Sequential IO ^

Flash devices
Reads


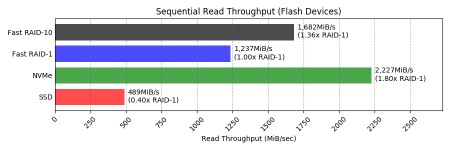
RAID-10 appears to work very well for sequential read IO. Remember these are mismatched devices; when reads come from both, things are not going to perform as well as the fastest device (NVMe). Still, RAID-10 achieves nearly 3.5 times the throughput of SSD alone and has some redundancy.

Why is RAID-10 1.36x faster than RAID-1 here? I’ve read that Linux RAID-10 can stripe a single process’s IO across multiple devices whereas with RAID-1 each process gets one device to read from. I’m not sure how that can apply here though, as these are 4KiB IOs which seem unlikely to be split between devices.

Looking at the raw fio output, for RAID-1 ~77% of the IOs went to the NVMe. For RAID-10 ~86% of the IOs went to the NVMe. So that is an explanation of sorts: if you get more of your IO from a faster device, your IO obviously ends up faster. It does not explain why RAID-10 is better at directing sequential IO than RAID-1 is though.

Writes


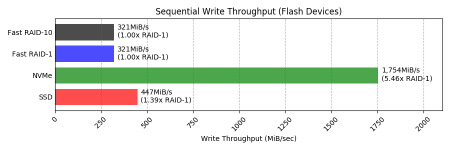
Here we can see that both kinds of RAID perform the same and definitely introduce overhead – they’re both about 72% the speed of the slowest device (the SSD). Still, for many uses you may not notice the difference, and the redundancy is required.

Rotational devices
Read


Any kind of RAID here is doing wonders for sequential read performance. I have no idea how or why RAID-10 can be over 7x faster than a single HDD. The RAID-1 is 5% slower than RAID-10 but it’s unclear if that’s significant or within bounds of test error.

It feels like a cache is involved here. Direct IO is being used but that’s only going to bypass the Linux page cache. Are the HDDs themselves caching this? They only have 128MB of cache though. Is there a read-ahead somewhere that is helping?

Write


This one is looking a lot more how I would expect. Again both RAIDs are going a little slower than the slowest device. This time it’s the RAID-10 that is about 6% faster, but again this could be within the bounds of error.

Random IO ^

Flash devices
Read


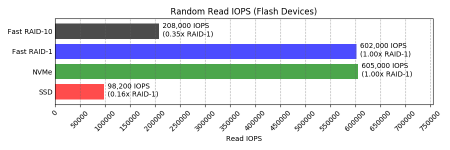
This is exactly the kind of WTF that prompted me to look into this more deeply. Why is RAID-10 about a third the random read performance of RAID-1!?

Update: the answer seems to have been found.

If using RAID-1 it is nice to see that you can pair an omg-my-wallet SSD with a slightly less omg-my-wallet NVMe and still get close to the NVMe levels of random read performance. Looking at the raw fio output, ~84% of the IOs hit the NVMe side of the mirror.

Looking at those stats for the RAID-10, the NVMe side got 53% of IOs. I don’t know if it is deliberate but I don’t think that Linux RAID-10 is able to source these IOs from the fastest device, to its massive detriment when there is such a big disparity. RAID-10 random read has ended up about twice the performance of the slowest device, but when the fastest device is more than 6 times faster than the slowest one you’d really like to get nearer to the fastest one!

Write


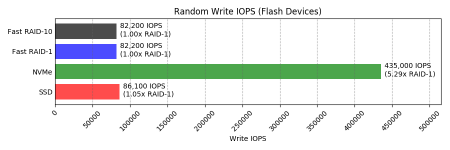
Things return to expectations with random writes. Both kinds of RAID perform about as fast as the slowest device, I guess because Linux has to wait for writes on both sides of the mirror to complete.

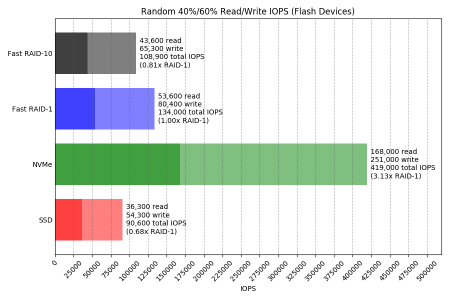
40%/60% read/write


Here RAID-10 is ~20% slower than RAID-1. I think this is because on RAID-1 the (smaller percentage of) read IOs are benefiting from whatever we see above for the pure random read test, while the (larger percentage of) write IOs are performing the same for both RAID-1 and RAID-10.

Looking at the raw fio output, for RAID-1 the NVMe device got 94% of the read IOs! They split the write IOs 50/50 as you’d expect since both sides have to have a copy written.

Looking at the output for RAID-10, the NVMe device got 50% of the read IOs. It’s easy to see why performance is lower here for RAID-10, though still not clear to me if this is by design and generally known.

This 40/60 split of read/write may seem an odd benchmarking choice but it’s actually fairly representative of our busiest VM hosting servers.

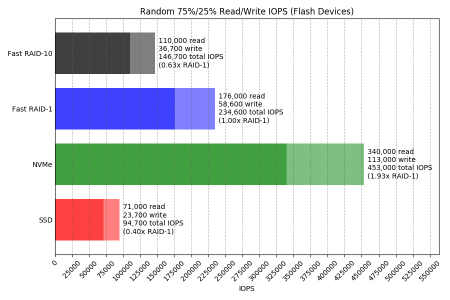
75%/25% read/write


The more usual random 75%/25% read/write test also bears out the same evidence that RAID-1 reads are happening at close to the speed of the fastest device while RAID-10 reads are happening only a bit faster than the slowest device.

Rotational devices
Read


There’s something wrong with this test. Again I suspect it’s hitting a cache somewhere because a 5.4kRPM SATA HDD is not capable of 256 IOPS! It should max out at about a quarter of this.

If someone could give me some hints as to what might be wrong with this test I’d appreciate it. To recap, it’s doing random 4KiB IO with 4 processes across an 8GiB file, so in total 32GiB will be read. In fio, the libaio engine with direct=1 is used, in an attempt to bypass Linux page cache.

Looking at the raw fio output:

  IO depths    : 1=0.1%, 2=0.1%, 4=0.1%, 8=0.1%, 16=0.1%, 32=100.0%, >=64=0.0%
     submit    : 0=0.0%, 4=100.0%, 8=0.0%, 16=0.0%, 32=0.0%, 64=0.0%, >=64=0.0%
     complete  : 0=0.0%, 4=100.0%, 8=0.0%, 16=0.0%, 32=0.1%, 64=0.0%, >=64=0.0%
     issued rwts: total=922360,0,0,0 short=0,0,0,0 dropped=0,0,0,0
     latency   : target=0, window=0, percentile=100.00%, depth=32
 
[…]
 
Disk stats (read/write):
  sdd: ios=922292/3, merge=27/1, ticks=217720971/727, in_queue=113860764, util=98.94%

So that is 922,360 read IOs issued, and 922,292 of them actually hit the disk. As far as I am aware that means close to zero of them came out Linux’s page cache; if there is caching involved does that mean it can only be the drive’s own cache?

As far as replicating this RAID-10 random read performance hole, both RAID-1 and RAID-10 sent about half the IOs to each device so it won’t show itself even if I do fix the test.

Write


Now this brings me back to the safe and comfortable (as long as I don’t have to actually live there) lands of HDD performance. I can believe that the HDD does 57 write IOPS, maybe with a little help from its own write cache. I don’t know why RAID-1 performs about a third as fast as a single device (why not the same as the slowest device?). Maybe it can’t take advantage of a write cache, and the real performance of each device is ~25 IOPS?

I am a bit concerned that again RAID-10 seems to perform worse than RAID-1. I think 16% will be beyond the bounds of testing error. The question is whether it is down to a flaw in my testing methodology. Looking at the raw fio outputs I am a bit puzzled why one HDD has much higher disk utilization values:

slow-raid1_randwrite: (g=0): rw=randwrite, bs=(R) 4096B-4096B, (W) 4096B-4096B, (T) 4096B-4096B, ioengine=libaio, iodepth=32
[…]
Disk stats (read/write):
    md6: ios=0/91688, merge=0/0, ticks=0/0, in_queue=0, util=0.00%, aggrios=0/91744, aggrmerge=0/497, aggrticks=0/44113055, aggrin_queue=4778486, aggrutil=14.52%
  sde: ios=0/91740, merge=0/502, ticks=0/7593320, in_queue=354720, util=1.31%
  sdd: ios=0/91749, merge=0/493, ticks=0/80632791, in_queue=9202252, util=14.52%
slow-raid10_randwrite: (groupid=0, jobs=4): err= 0: pid=23949: Mon May 27 14:32:34 2019
[…]
Disk stats (read/write):
    md7: ios=0/78691, merge=0/0, ticks=0/0, in_queue=0, util=0.00%, aggrios=0/78719, aggrmerge=0/506, aggrticks=0/43822275, aggrin_queue=5006454, aggrutil=15.52%
  sde: ios=0/78716, merge=0/510, ticks=0/6980884, in_queue=264756, util=1.18%
  sdd: ios=0/78723, merge=0/503, ticks=0/80663667, in_queue=9748152, util=15.52%

This actually does not happen in any of the other tests — only the random read tests — and it’s sdd both times. I don’t know if that is significant. Does it even matter as long as the disk is less than 100% utilized?

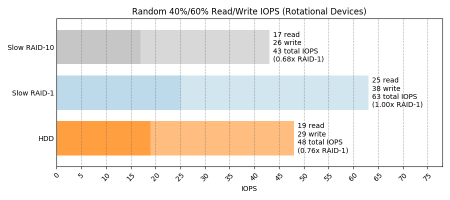
40%/60% read/write


This seems to be consistent with the random write results – RAID-10 doesn’t like random writes.

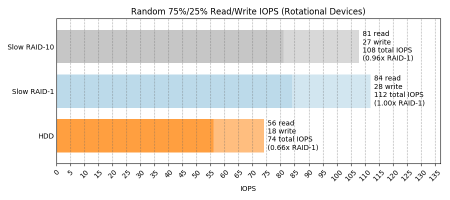
75%/25% read/write


Again consistent with the random write and the 40/60 read/write test. Here there’s fewer writes, so the RAID-10 performance gap is smaller, but it’s there.

Data tables ^

If you’re not interested in tables of stuff that you already saw pretty pictures for, skip to a summary of my confusions.

Sequential IO ^

Test Throughput (MiB/s)
SSD NVMe HDD Fast RAID-1 Fast RAID-10 Slow RAID-1 Slow RAID-10
Read 489 2,227 26 1,237 1,682 198 188
Write 447 1,754 20 321 321 18 19

Random IO ^

Test IOPS
SSD NVMe HDD Fast RAID-1 Fast RAID-10 Slow RAID-1 Slow RAID-10
Random Read 98,200 605,000 256 602,000 208,000 501 501
Random Write 86,100 435,000 74 82,200 82,200 25 21
Random 40/60 Read/Write Reads 36,300 168,000 19 53,600 43,600 25 17
Writes 54,300 252,000 29 80,400 65,300 38 26
Random 75/25 Read/Write Reads 71,000 340,000 56 176,000 110,000 84 81
Writes 23,700 113,000 18 58,600 36,700 28 27

Summary of open questions ^

Numbered for ease of clue-giving in the comments. Or on Twitter. I also made a post to the linux-raid mailing list. Even if you can’t figure out what I did wrong but have other tests you’d like to see me do, please let me know.

  1. Why is RAID-10 better at requesting sequential read IO from a faster device, such that in my tests it performed 1.36x faster than RAID-1?
  2. Why does a test of sequential read performance of HDDs achieve 28MiB/sec against a single HDD but over 7 times this for RAID? Is it because RAID uses readahead?
  3. When there is a huge disparity in device performance (e.g. 6x between SSD and NVMe), is it expected that RAID-1 is much better at using fast devices for read IO? Is there a reason why RAID-10 cannot do what RAID-1 does here?
    Answer: Yes, and unknown, respectively.
  4. What is wrong with my random read IO test against the HDDs? I should not be able to get 256 IOPS out of a single HDD. Can it possibly be disk cache, when disk cache is only 128MiB and over 3GiB was read randomly from the disk?
  5. Why does one of my HDDs show about 14% higher utilization than the other during random read tests?
  6. Why does RAID-10 appear to perform about 16% worse than RAID-1 for random writes against HDD devices?

Setup ^

Hardware ^

  • Single Xeon W-2145 CPU @ 3.7GHz
  • 256GiB memory
  • 1x Samsung SM883 SATA SSD
  • 1x Samsung PM983 NVMe
  • 2x Seagate ST5000LM000 5.4kRPM SATA HDD

Operating system ^

  • Debian buster
  • linux-image-4.19.0-4-amd64 4.19.28-2
  • mdadm – v4.1 – 2018-10-01
  • No special tweaks

Storage ^

Partitioning ^

Each of the storage devices were given three 10GiB partitions. Example partition table:

$ sudo gdisk -l /dev/sdc
GPT fdisk (gdisk) version 1.0.3
 
Partition table scan:
  MBR: protective
  BSD: not present
  APM: not present
  GPT: present
 
Found valid GPT with protective MBR; using GPT.
Disk /dev/sdc: 7501476528 sectors, 3.5 TiB
Model: SAMSUNG MZ7KH3T8
Sector size (logical/physical): 512/4096 bytes
Disk identifier (GUID): 7D7DFDA2-502C-47FE-A437-5442CCCE7E6B
Partition table holds up to 128 entries
Main partition table begins at sector 2 and ends at sector 33
First usable sector is 34, last usable sector is 7501476494
Partitions will be aligned on 2048-sector boundaries
Total free space is 7438561901 sectors (3.5 TiB)
 
Number  Start (sector)    End (sector)  Size       Code  Name
   1            2048        20973567   10.0 GiB    8300  Linux filesystem
   2        20973568        41945087   10.0 GiB    8300  Linux filesystem
   3        41945088        62916607   10.0 GiB    8300  Linux filesystem

Partition usage:

  1. Raw device
  2. RAID-1 member
  3. RAID-10 member

RAID arrays ^

RAID devices were created as follows:

$ sudo mdadm --create \
    --verbose \
    --assume-clean /dev/md4 \
    --level=1 --raid-devices=2 --size=10G \
    /dev/nvme0n1p2 /dev/sdc2
$ sudo mdadm --create \
    --verbose \
    --assume-clean /dev/md5 \
    --level=10 --raid-devices=2 --size=10G \
    /dev/nvme0n1p3 /dev/sdc3
$ sudo mdadm --create \
    --verbose \
    --assume-clean /dev/md6 \
    --level=1 --raid-devices=2 --size=10G \
    /dev/sdd2 /dev/sde2
$ sudo mdadm --create \
    --verbose \
    --assume-clean /dev/md7 \
    --level=10 --raid-devices=2 --size=10G \
    /dev/sdd3 /dev/sde3

Filesystems ^

In all cases an ext4 filesystem was created on the raw partitions and each of the RAID arrays as follows:

$ for dev in /dev/sdc1 /dev/nvme0n1p1 /dev/sdd1 /dev/md{4,5,6,7}; do \
    sudo mkfs.ext4 -E lazy_itable_init=0,lazy_journal_init=0 $dev; \
done

Testing methodology ^

All testing was done with fio. Performance of both sequential throughput and random IO was tested.

Common parameters ^

  • 4KiB IO size
  • 4 jobs
  • IO depth of 32
  • libaio IO engine
  • Direct IO (attempt to avoid Linux page cache)
  • 8GiB data file
  • 60 minute run time limit (flash devices finish their 4*8GiB workload much faster than this)
  • gtod_reduce

Sequential throughput ^

Metric reported is average throughput (MiB per second).

  • 100% read
  • 100% write

Random IO ^

Metric reported is average IO operations per second (IOPS).

The 40/60 mix is representative of the production read/write mix on our production hosts.

  • 100% read
  • 100% write
  • 40/60 read/write
  • 75/25 read/write

Full fio script ^

#!/bin/bash
 
set -eu
 
fio=/opt/fio/bin/fio
 
numjobs=4
iodepth=32
runtime=3600
 
targets=(ssd nvme hdd fast-raid1 fast-raid10 slow-raid1 slow-raid10)
 
ts=$(date --utc +%FT%TZ)
 
# seq read
for target in "${targets[@]}"; do
    $fio --name="${target}_seqread" \
        --filename="/mnt/${target}/fio" \
        --ioengine=libaio \
        --readwrite=read \
        --direct=1 \
        --numjobs=${numjobs} \
        --bs=4k \
        --iodepth=${iodepth} \
        --size=8g \
        --runtime=${runtime}s \
        --gtod_reduce=1 \
        --group_reporting | tee -a /home/andy/fio.${ts}.txt
done
 
# seq write
for target in "${targets[@]}"; do
    $fio --name="${target}_seqwrite" \
        --filename="/mnt/${target}/fio" \
        --ioengine=libaio \
        --readwrite=write \
        --direct=1 \
        --numjobs=${numjobs} \
        --bs=4k \
        --iodepth=${iodepth} \
        --size=8g \
        --runtime=${runtime}s \
        --gtod_reduce=1 \
        --group_reporting | tee -a /home/andy/fio.${ts}.txt
done
 
# random read
for target in "${targets[@]}"; do
    $fio --name="${target}_randread" \
        --filename="/mnt/${target}/fio" \
        --ioengine=libaio \
        --readwrite=randread \
        --direct=1 \
        --numjobs=${numjobs} \
        --bs=4k \
        --iodepth=${iodepth} \
        --size=8g \
        --runtime=${runtime}s \
        --gtod_reduce=1 \
        --group_reporting | tee -a /home/andy/fio.${ts}.txt
done
 
# random write
for target in "${targets[@]}"; do
    $fio --name="${target}_randwrite" \
        --filename="/mnt/${target}/fio" \
        --ioengine=libaio \
        --readwrite=randwrite \
        --direct=1 \
        --numjobs=${numjobs} \
        --bs=4k \
        --iodepth=${iodepth} \
        --size=8g \
        --runtime=${runtime}s \
        --gtod_reduce=1 \
        --group_reporting | tee -a /home/andy/fio.${ts}.txt
done
 
# 40/60 random read/write
for target in "${targets[@]}"; do
    $fio --name="${target}_rand40read" \
        --filename="/mnt/${target}/fio" \
        --ioengine=libaio \
        --readwrite=randrw \
        --rwmixread=40 \
        --direct=1 \
        --numjobs=${numjobs} \
        --bs=4k \
        --iodepth=${iodepth} \
        --size=8g \
        --runtime=${runtime}s \
        --gtod_reduce=1 \
        --group_reporting | tee -a /home/andy/fio.${ts}.txt
done
 
# 75/25 random read/write
for target in "${targets[@]}"; do
    $fio --name="${target}_rand75read" \
        --filename="/mnt/${target}/fio" \
        --ioengine=libaio \
        --readwrite=randrw \
        --rwmixread=75 \
        --direct=1 \
        --numjobs=${numjobs} \
        --bs=4k \
        --iodepth=${iodepth} \
        --size=8g \
        --runtime=${runtime}s \
        --gtod_reduce=1 \
        --group_reporting | tee -a /home/andy/fio.${ts}.txt
done

Full script output ^

This is massive and it’s also the last thing in this post, so stop reading now if you’re not interested in all the fio output.

ssd_seqread: (g=0): rw=read, bs=(R) 4096B-4096B, (W) 4096B-4096B, (T) 4096B-4096B, ioengine=libaio, iodepth=32
...
fio-3.13-42-g8066f
Starting 4 processes
 
ssd_seqread: (groupid=0, jobs=4): err= 0: pid=19203: Mon May 27 06:24:01 2019
  read: IOPS=125k, BW=489MiB/s (513MB/s)(32.0GiB/66986msec)
   bw (  KiB/s): min=498224, max=504592, per=100.00%, avg=501087.91, stdev=271.65, samples=532
   iops        : min=124556, max=126148, avg=125271.98, stdev=67.91, samples=532
  cpu          : usr=4.15%, sys=19.62%, ctx=1863599, majf=0, minf=162
  IO depths    : 1=0.1%, 2=0.1%, 4=0.1%, 8=0.1%, 16=0.1%, 32=100.0%, >=64=0.0%
     submit    : 0=0.0%, 4=100.0%, 8=0.0%, 16=0.0%, 32=0.0%, 64=0.0%, >=64=0.0%
     complete  : 0=0.0%, 4=100.0%, 8=0.0%, 16=0.0%, 32=0.1%, 64=0.0%, >=64=0.0%
     issued rwts: total=8388608,0,0,0 short=0,0,0,0 dropped=0,0,0,0
     latency   : target=0, window=0, percentile=100.00%, depth=32
 
Run status group 0 (all jobs):
   READ: bw=489MiB/s (513MB/s), 489MiB/s-489MiB/s (513MB/s-513MB/s), io=32.0GiB (34.4GB), run=66986-66986msec
 
Disk stats (read/write):
  sdc: ios=2251963/0, merge=6127068/0, ticks=2247864/0, in_queue=2133512, util=100.00%
nvme_seqread: (g=0): rw=read, bs=(R) 4096B-4096B, (W) 4096B-4096B, (T) 4096B-4096B, ioengine=libaio, iodepth=32
...
fio-3.13-42-g8066f
Starting 4 processes
 
nvme_seqread: (groupid=0, jobs=4): err= 0: pid=19240: Mon May 27 06:24:16 2019
  read: IOPS=570k, BW=2227MiB/s (2335MB/s)(32.0GiB/14715msec)
   bw (  MiB/s): min= 2196, max= 2245, per=100.00%, avg=2227.14, stdev= 2.69, samples=116
   iops        : min=562182, max=574866, avg=570147.93, stdev=687.78, samples=116
  cpu          : usr=11.69%, sys=38.24%, ctx=3450565, majf=0, minf=166
  IO depths    : 1=0.1%, 2=0.1%, 4=0.1%, 8=0.1%, 16=0.1%, 32=100.0%, >=64=0.0%
     submit    : 0=0.0%, 4=100.0%, 8=0.0%, 16=0.0%, 32=0.0%, 64=0.0%, >=64=0.0%
     complete  : 0=0.0%, 4=100.0%, 8=0.0%, 16=0.0%, 32=0.1%, 64=0.0%, >=64=0.0%
     issued rwts: total=8388608,0,0,0 short=0,0,0,0 dropped=0,0,0,0
     latency   : target=0, window=0, percentile=100.00%, depth=32
 
Run status group 0 (all jobs):
   READ: bw=2227MiB/s (2335MB/s), 2227MiB/s-2227MiB/s (2335MB/s-2335MB/s), io=32.0GiB (34.4GB), run=14715-14715msec
 
Disk stats (read/write):
  nvme0n1: ios=8350844/0, merge=0/0, ticks=1833161/0, in_queue=2068976, util=100.00%
hdd_seqread: (g=0): rw=read, bs=(R) 4096B-4096B, (W) 4096B-4096B, (T) 4096B-4096B, ioengine=libaio, iodepth=32
...
fio-3.13-42-g8066f
Starting 4 processes
 
hdd_seqread: (groupid=0, jobs=4): err= 0: pid=19265: Mon May 27 06:45:09 2019
  read: IOPS=6696, BW=26.2MiB/s (27.4MB/s)(32.0GiB/1252663msec)
   bw (  KiB/s): min=20832, max=29528, per=100.00%, avg=26785.12, stdev=195.38, samples=10020
   iops        : min= 5208, max= 7382, avg=6696.23, stdev=48.85, samples=10020
  cpu          : usr=0.77%, sys=2.53%, ctx=2237416, majf=0, minf=169
  IO depths    : 1=0.1%, 2=0.1%, 4=0.1%, 8=0.1%, 16=0.1%, 32=100.0%, >=64=0.0%
     submit    : 0=0.0%, 4=100.0%, 8=0.0%, 16=0.0%, 32=0.0%, 64=0.0%, >=64=0.0%
     complete  : 0=0.0%, 4=100.0%, 8=0.0%, 16=0.0%, 32=0.1%, 64=0.0%, >=64=0.0%
     issued rwts: total=8388608,0,0,0 short=0,0,0,0 dropped=0,0,0,0
     latency   : target=0, window=0, percentile=100.00%, depth=32
 
Run status group 0 (all jobs):
   READ: bw=26.2MiB/s (27.4MB/s), 26.2MiB/s-26.2MiB/s (27.4MB/s-27.4MB/s), io=32.0GiB (34.4GB), run=1252663-1252663msec
 
Disk stats (read/write):
  sdd: ios=2161877/0, merge=6188663/0, ticks=41221865/0, in_queue=40014352, util=99.87%
fast-raid1_seqread: (g=0): rw=read, bs=(R) 4096B-4096B, (W) 4096B-4096B, (T) 4096B-4096B, ioengine=libaio, iodepth=32
...
fio-3.13-42-g8066f
Starting 4 processes
 
fast-raid1_seqread: (groupid=0, jobs=4): err= 0: pid=19567: Mon May 27 06:45:36 2019
  read: IOPS=317k, BW=1237MiB/s (1298MB/s)(32.0GiB/26481msec)
   bw (  MiB/s): min= 1190, max= 1285, per=99.98%, avg=1237.17, stdev= 5.25, samples=208
   iops        : min=304852, max=328962, avg=316715.02, stdev=1345.21, samples=208
  cpu          : usr=6.59%, sys=39.68%, ctx=1439256, majf=0, minf=164
  IO depths    : 1=0.1%, 2=0.1%, 4=0.1%, 8=0.1%, 16=0.1%, 32=100.0%, >=64=0.0%
     submit    : 0=0.0%, 4=100.0%, 8=0.0%, 16=0.0%, 32=0.0%, 64=0.0%, >=64=0.0%
     complete  : 0=0.0%, 4=100.0%, 8=0.0%, 16=0.0%, 32=0.1%, 64=0.0%, >=64=0.0%
     issued rwts: total=8388608,0,0,0 short=0,0,0,0 dropped=0,0,0,0
     latency   : target=0, window=0, percentile=100.00%, depth=32
 
Run status group 0 (all jobs):
   READ: bw=1237MiB/s (1298MB/s), 1237MiB/s-1237MiB/s (1298MB/s-1298MB/s), io=32.0GiB (34.4GB), run=26481-26481msec
 
Disk stats (read/write):
    md4: ios=8360606/0, merge=0/0, ticks=0/0, in_queue=0, util=0.00%, aggrios=3539364/0, aggrmerge=654930/0, aggrticks=1150607/0, aggrin_queue=1162162, aggrutil=100.00%
  sdc: ios=1656610/0, merge=1309860/0, ticks=833468/0, in_queue=816236, util=99.51%
  nvme0n1: ios=5422119/0, merge=0/0, ticks=1467747/0, in_queue=1508088, util=100.00%
fast-raid10_seqread: (g=0): rw=read, bs=(R) 4096B-4096B, (W) 4096B-4096B, (T) 4096B-4096B, ioengine=libaio, iodepth=32
...
fio-3.13-42-g8066f
Starting 4 processes
 
fast-raid10_seqread: (groupid=0, jobs=4): err= 0: pid=19596: Mon May 27 06:45:56 2019
  read: IOPS=431k, BW=1682MiB/s (1763MB/s)(32.0GiB/19485msec)
   bw (  MiB/s): min= 1660, max= 5369, per=100.00%, avg=2840.84, stdev=450.11, samples=107
   iops        : min=425100, max=1374556, avg=727254.32, stdev=115227.08, samples=107
  cpu          : usr=10.61%, sys=46.21%, ctx=956991, majf=0, minf=169
  IO depths    : 1=0.1%, 2=0.1%, 4=0.1%, 8=0.1%, 16=0.1%, 32=100.0%, >=64=0.0%
     submit    : 0=0.0%, 4=100.0%, 8=0.0%, 16=0.0%, 32=0.0%, 64=0.0%, >=64=0.0%
     complete  : 0=0.0%, 4=100.0%, 8=0.0%, 16=0.0%, 32=0.1%, 64=0.0%, >=64=0.0%
     issued rwts: total=8388608,0,0,0 short=0,0,0,0 dropped=0,0,0,0
     latency   : target=0, window=0, percentile=100.00%, depth=32
 
Run status group 0 (all jobs):
   READ: bw=1682MiB/s (1763MB/s), 1682MiB/s-1682MiB/s (1763MB/s-1763MB/s), io=32.0GiB (34.4GB), run=19485-19485msec
 
Disk stats (read/write):
    md5: ios=8354245/3, merge=0/0, ticks=0/0, in_queue=0, util=0.00%, aggrios=3785476/4, aggrmerge=408786/1, aggrticks=295278/4, aggrin_queue=288072, aggrutil=99.82%
  nvme0n1: ios=6479930/4, merge=0/1, ticks=46423/0, in_queue=46280, util=99.82%
  sdc: ios=1091022/5, merge=817572/1, ticks=544134/8, in_queue=529864, util=98.78%
slow-raid1_seqread: (g=0): rw=read, bs=(R) 4096B-4096B, (W) 4096B-4096B, (T) 4096B-4096B, ioengine=libaio, iodepth=32
...
fio-3.13-42-g8066f
Starting 4 processes
 
slow-raid1_seqread: (groupid=0, jobs=4): err= 0: pid=19623: Mon May 27 06:48:42 2019
  read: IOPS=50.8k, BW=198MiB/s (208MB/s)(32.0GiB/165096msec)
   bw (  KiB/s): min=120944, max=589128, per=100.00%, avg=312508.47, stdev=59646.40, samples=1011
   iops        : min=30236, max=147282, avg=78127.09, stdev=14911.62, samples=1011
  cpu          : usr=2.68%, sys=17.62%, ctx=7840715, majf=0, minf=170
  IO depths    : 1=0.1%, 2=0.1%, 4=0.1%, 8=0.1%, 16=0.1%, 32=100.0%, >=64=0.0%
     submit    : 0=0.0%, 4=100.0%, 8=0.0%, 16=0.0%, 32=0.0%, 64=0.0%, >=64=0.0%
     complete  : 0=0.0%, 4=100.0%, 8=0.0%, 16=0.0%, 32=0.1%, 64=0.0%, >=64=0.0%
     issued rwts: total=8388608,0,0,0 short=0,0,0,0 dropped=0,0,0,0
     latency   : target=0, window=0, percentile=100.00%, depth=32
 
Run status group 0 (all jobs):
   READ: bw=198MiB/s (208MB/s), 198MiB/s-198MiB/s (208MB/s-208MB/s), io=32.0GiB (34.4GB), run=165096-165096msec
 
Disk stats (read/write):
    md6: ios=8375702/4, merge=0/0, ticks=0/0, in_queue=0, util=0.00%, aggrios=3942792/8, aggrmerge=246472/1, aggrticks=5293402/364, aggrin_queue=5228076, aggrutil=99.83%
  sde: ios=5761197/8, merge=59878/1, ticks=5227721/336, in_queue=5207544, util=99.76%
  sdd: ios=2124388/8, merge=433067/1, ticks=5359084/392, in_queue=5248608, util=99.83%
slow-raid10_seqread: (g=0): rw=read, bs=(R) 4096B-4096B, (W) 4096B-4096B, (T) 4096B-4096B, ioengine=libaio, iodepth=32
...
fio-3.13-42-g8066f
Starting 4 processes
 
slow-raid10_seqread: (groupid=0, jobs=4): err= 0: pid=19672: Mon May 27 06:51:37 2019
  read: IOPS=48.1k, BW=188MiB/s (197MB/s)(32.0GiB/174318msec)
   bw (  KiB/s): min=117760, max=588752, per=100.00%, avg=285330.33, stdev=49931.94, samples=1052
   iops        : min=29440, max=147188, avg=71332.29, stdev=12482.89, samples=1052
  cpu          : usr=2.65%, sys=16.99%, ctx=7903054, majf=0, minf=162
  IO depths    : 1=0.1%, 2=0.1%, 4=0.1%, 8=0.1%, 16=0.1%, 32=100.0%, >=64=0.0%
     submit    : 0=0.0%, 4=100.0%, 8=0.0%, 16=0.0%, 32=0.0%, 64=0.0%, >=64=0.0%
     complete  : 0=0.0%, 4=100.0%, 8=0.0%, 16=0.0%, 32=0.1%, 64=0.0%, >=64=0.0%
     issued rwts: total=8388608,0,0,0 short=0,0,0,0 dropped=0,0,0,0
     latency   : target=0, window=0, percentile=100.00%, depth=32
 
Run status group 0 (all jobs):
   READ: bw=188MiB/s (197MB/s), 188MiB/s-188MiB/s (197MB/s-197MB/s), io=32.0GiB (34.4GB), run=174318-174318msec
 
Disk stats (read/write):
    md7: ios=8382423/4, merge=0/0, ticks=0/0, in_queue=0, util=0.00%, aggrios=3990234/8, aggrmerge=203371/1, aggrticks=5499680/371, aggrin_queue=5432004, aggrutil=99.83%
  sde: ios=5773992/8, merge=11192/1, ticks=5402117/359, in_queue=5381584, util=99.79%
  sdd: ios=2206477/8, merge=395550/1, ticks=5597244/383, in_queue=5482424, util=99.83%
ssd_seqwrite: (g=0): rw=write, bs=(R) 4096B-4096B, (W) 4096B-4096B, (T) 4096B-4096B, ioengine=libaio, iodepth=32
...
fio-3.13-42-g8066f
Starting 4 processes
 
ssd_seqwrite: (groupid=0, jobs=4): err= 0: pid=19725: Mon May 27 06:52:51 2019
  write: IOPS=115k, BW=447MiB/s (469MB/s)(32.0GiB/73261msec); 0 zone resets
   bw (  KiB/s): min=421064, max=463912, per=100.00%, avg=458109.77, stdev=2065.39, samples=584
   iops        : min=105266, max=115978, avg=114527.41, stdev=516.35, samples=584
  cpu          : usr=3.48%, sys=21.52%, ctx=2277712, majf=0, minf=37
  IO depths    : 1=0.1%, 2=0.1%, 4=0.1%, 8=0.1%, 16=0.1%, 32=100.0%, >=64=0.0%
     submit    : 0=0.0%, 4=100.0%, 8=0.0%, 16=0.0%, 32=0.0%, 64=0.0%, >=64=0.0%
     complete  : 0=0.0%, 4=100.0%, 8=0.0%, 16=0.0%, 32=0.1%, 64=0.0%, >=64=0.0%
     issued rwts: total=0,8388608,0,0 short=0,0,0,0 dropped=0,0,0,0
     latency   : target=0, window=0, percentile=100.00%, depth=32
 
Run status group 0 (all jobs):
  WRITE: bw=447MiB/s (469MB/s), 447MiB/s-447MiB/s (469MB/s-469MB/s), io=32.0GiB (34.4GB), run=73261-73261msec
 
Disk stats (read/write):
  sdc: ios=0/2238107, merge=0/6047456, ticks=0/2478437, in_queue=2335432, util=99.96%
nvme_seqwrite: (g=0): rw=write, bs=(R) 4096B-4096B, (W) 4096B-4096B, (T) 4096B-4096B, ioengine=libaio, iodepth=32
...
fio-3.13-42-g8066f
Starting 4 processes
 
nvme_seqwrite: (groupid=0, jobs=4): err= 0: pid=19758: Mon May 27 06:53:10 2019
  write: IOPS=449k, BW=1754MiB/s (1839MB/s)(32.0GiB/18681msec); 0 zone resets
   bw (  MiB/s): min= 1623, max= 1857, per=99.98%, avg=1753.65, stdev=17.41, samples=148
   iops        : min=415654, max=475538, avg=448934.59, stdev=4456.41, samples=148
  cpu          : usr=8.61%, sys=56.50%, ctx=1664510, majf=0, minf=42
  IO depths    : 1=0.1%, 2=0.1%, 4=0.1%, 8=0.1%, 16=0.1%, 32=100.0%, >=64=0.0%
     submit    : 0=0.0%, 4=100.0%, 8=0.0%, 16=0.0%, 32=0.0%, 64=0.0%, >=64=0.0%
     complete  : 0=0.0%, 4=100.0%, 8=0.0%, 16=0.0%, 32=0.1%, 64=0.0%, >=64=0.0%
     issued rwts: total=0,8388608,0,0 short=0,0,0,0 dropped=0,0,0,0
     latency   : target=0, window=0, percentile=100.00%, depth=32
 
Run status group 0 (all jobs):
  WRITE: bw=1754MiB/s (1839MB/s), 1754MiB/s-1754MiB/s (1839MB/s-1839MB/s), io=32.0GiB (34.4GB), run=18681-18681msec
 
Disk stats (read/write):
  nvme0n1: ios=0/8373430, merge=0/3, ticks=0/2210464, in_queue=2410804, util=100.00%
hdd_seqwrite: (g=0): rw=write, bs=(R) 4096B-4096B, (W) 4096B-4096B, (T) 4096B-4096B, ioengine=libaio, iodepth=32
...
fio-3.13-42-g8066f
Starting 4 processes
 
hdd_seqwrite: (groupid=0, jobs=4): err= 0: pid=19786: Mon May 27 07:20:26 2019
  write: IOPS=5129, BW=20.0MiB/s (21.0MB/s)(32.0GiB/1635487msec); 0 zone resets
   bw (  KiB/s): min= 1344, max=49824, per=100.00%, avg=20526.55, stdev=2973.47, samples=13072
   iops        : min=  336, max=12456, avg=5131.58, stdev=743.37, samples=13072
  cpu          : usr=0.45%, sys=1.73%, ctx=2138826, majf=0, minf=34
  IO depths    : 1=0.1%, 2=0.1%, 4=0.1%, 8=0.1%, 16=0.1%, 32=100.0%, >=64=0.0%
     submit    : 0=0.0%, 4=100.0%, 8=0.0%, 16=0.0%, 32=0.0%, 64=0.0%, >=64=0.0%
     complete  : 0=0.0%, 4=100.0%, 8=0.0%, 16=0.0%, 32=0.1%, 64=0.0%, >=64=0.0%
     issued rwts: total=0,8388608,0,0 short=0,0,0,0 dropped=0,0,0,0
     latency   : target=0, window=0, percentile=100.00%, depth=32
 
Run status group 0 (all jobs):
  WRITE: bw=20.0MiB/s (21.0MB/s), 20.0MiB/s-20.0MiB/s (21.0MB/s-21.0MB/s), io=32.0GiB (34.4GB), run=1635487-1635487msec
 
Disk stats (read/write):
  sdd: ios=0/2151560, merge=0/6224246, ticks=0/51570499, in_queue=49570692, util=96.59%
fast-raid1_seqwrite: (g=0): rw=write, bs=(R) 4096B-4096B, (W) 4096B-4096B, (T) 4096B-4096B, ioengine=libaio, iodepth=32
...
fio-3.13-42-g8066f
Starting 4 processes
 
fast-raid1_seqwrite: (groupid=0, jobs=4): err= 0: pid=20133: Mon May 27 07:22:08 2019
  write: IOPS=82.2k, BW=321MiB/s (337MB/s)(32.0GiB/102043msec); 0 zone resets
   bw (  KiB/s): min=309848, max=386576, per=100.00%, avg=329052.54, stdev=1516.96, samples=814
   iops        : min=77462, max=96644, avg=82263.12, stdev=379.24, samples=814
  cpu          : usr=2.33%, sys=35.15%, ctx=966557, majf=0, minf=39
  IO depths    : 1=0.1%, 2=0.1%, 4=0.1%, 8=0.1%, 16=0.1%, 32=100.0%, >=64=0.0%
     submit    : 0=0.0%, 4=100.0%, 8=0.0%, 16=0.0%, 32=0.0%, 64=0.0%, >=64=0.0%
     complete  : 0=0.0%, 4=100.0%, 8=0.0%, 16=0.0%, 32=0.1%, 64=0.0%, >=64=0.0%
     issued rwts: total=0,8388608,0,0 short=0,0,0,0 dropped=0,0,0,0
     latency   : target=0, window=0, percentile=100.00%, depth=32
 
Run status group 0 (all jobs):
  WRITE: bw=321MiB/s (337MB/s), 321MiB/s-321MiB/s (337MB/s-337MB/s), io=32.0GiB (34.4GB), run=102043-102043msec
 
Disk stats (read/write):
    md4: ios=0/8376455, merge=0/0, ticks=0/0, in_queue=0, util=0.00%, aggrios=0/8388458, aggrmerge=0/212, aggrticks=0/705526, aggrin_queue=734298, aggrutil=100.00%
  sdc: ios=0/8388268, merge=0/404, ticks=0/1288060, in_queue=1246864, util=98.49%
  nvme0n1: ios=0/8388649, merge=0/20, ticks=0/122992, in_queue=221732, util=100.00%
fast-raid10_seqwrite: (g=0): rw=write, bs=(R) 4096B-4096B, (W) 4096B-4096B, (T) 4096B-4096B, ioengine=libaio, iodepth=32
...
fio-3.13-42-g8066f
Starting 4 processes
 
fast-raid10_seqwrite: (groupid=0, jobs=4): err= 0: pid=20182: Mon May 27 07:23:51 2019
  write: IOPS=82.2k, BW=321MiB/s (337MB/s)(32.0GiB/101991msec); 0 zone resets
   bw (  KiB/s): min=319408, max=337072, per=99.99%, avg=328965.56, stdev=638.35, samples=812
   iops        : min=79852, max=84268, avg=82241.37, stdev=159.58, samples=812
  cpu          : usr=1.98%, sys=35.58%, ctx=965045, majf=0, minf=34
  IO depths    : 1=0.1%, 2=0.1%, 4=0.1%, 8=0.1%, 16=0.1%, 32=100.0%, >=64=0.0%
     submit    : 0=0.0%, 4=100.0%, 8=0.0%, 16=0.0%, 32=0.0%, 64=0.0%, >=64=0.0%
     complete  : 0=0.0%, 4=100.0%, 8=0.0%, 16=0.0%, 32=0.1%, 64=0.0%, >=64=0.0%
     issued rwts: total=0,8388608,0,0 short=0,0,0,0 dropped=0,0,0,0
     latency   : target=0, window=0, percentile=100.00%, depth=32
 
Run status group 0 (all jobs):
  WRITE: bw=321MiB/s (337MB/s), 321MiB/s-321MiB/s (337MB/s-337MB/s), io=32.0GiB (34.4GB), run=101991-101991msec
 
Disk stats (read/write):
    md5: ios=0/8380185, merge=0/0, ticks=0/0, in_queue=0, util=0.00%, aggrios=0/8388294, aggrmerge=0/387, aggrticks=0/703466, aggrin_queue=733542, aggrutil=100.00%
  nvme0n1: ios=0/8388656, merge=0/21, ticks=0/121330, in_queue=218748, util=100.00%
  sdc: ios=0/8387932, merge=0/753, ticks=0/1285603, in_queue=1248336, util=98.56%
slow-raid1_seqwrite: (g=0): rw=write, bs=(R) 4096B-4096B, (W) 4096B-4096B, (T) 4096B-4096B, ioengine=libaio, iodepth=32
...
fio-3.13-42-g8066f
Starting 4 processes
 
slow-raid1_seqwrite: (groupid=0, jobs=4): err= 0: pid=20227: Mon May 27 07:54:46 2019
  write: IOPS=4524, BW=17.7MiB/s (18.5MB/s)(32.0GiB/1854193msec); 0 zone resets
   bw (  KiB/s): min= 1023, max=109266, per=100.00%, avg=18383.76, stdev=4036.11, samples=14568
   iops        : min=  255, max=27315, avg=4595.85, stdev=1009.02, samples=14568
  cpu          : usr=0.35%, sys=3.25%, ctx=1507462, majf=0, minf=39
  IO depths    : 1=0.1%, 2=0.1%, 4=0.1%, 8=0.1%, 16=0.1%, 32=100.0%, >=64=0.0%
     submit    : 0=0.0%, 4=100.0%, 8=0.0%, 16=0.0%, 32=0.0%, 64=0.0%, >=64=0.0%
     complete  : 0=0.0%, 4=100.0%, 8=0.0%, 16=0.0%, 32=0.1%, 64=0.0%, >=64=0.0%
     issued rwts: total=0,8388608,0,0 short=0,0,0,0 dropped=0,0,0,0
     latency   : target=0, window=0, percentile=100.00%, depth=32
 
Run status group 0 (all jobs):
  WRITE: bw=17.7MiB/s (18.5MB/s), 17.7MiB/s-17.7MiB/s (18.5MB/s-18.5MB/s), io=32.0GiB (34.4GB), run=1854193-1854193msec
 
Disk stats (read/write):
    md6: ios=0/8387542, merge=0/0, ticks=0/0, in_queue=0, util=0.00%, aggrios=0/8301184, aggrmerge=0/88878, aggrticks=0/22516755, aggrin_queue=21684290, aggrutil=82.90%
  sde: ios=0/8300886, merge=0/89177, ticks=0/22832315, in_queue=21922472, util=82.90%
  sdd: ios=0/8301483, merge=0/88580, ticks=0/22201195, in_queue=21446108, util=81.09%
slow-raid10_seqwrite: (g=0): rw=write, bs=(R) 4096B-4096B, (W) 4096B-4096B, (T) 4096B-4096B, ioengine=libaio, iodepth=32
...
fio-3.13-42-g8066f
Starting 4 processes
 
slow-raid10_seqwrite: (groupid=0, jobs=4): err= 0: pid=20632: Mon May 27 08:24:04 2019
  write: IOPS=4771, BW=18.6MiB/s (19.5MB/s)(32.0GiB/1758142msec); 0 zone resets
   bw (  KiB/s): min=  304, max=123886, per=100.00%, avg=19558.79, stdev=4101.05, samples=13715
   iops        : min=   76, max=30970, avg=4889.57, stdev=1025.26, samples=13715
  cpu          : usr=0.39%, sys=3.58%, ctx=1502000, majf=0, minf=37
  IO depths    : 1=0.1%, 2=0.1%, 4=0.1%, 8=0.1%, 16=0.1%, 32=100.0%, >=64=0.0%
     submit    : 0=0.0%, 4=100.0%, 8=0.0%, 16=0.0%, 32=0.0%, 64=0.0%, >=64=0.0%
     complete  : 0=0.0%, 4=100.0%, 8=0.0%, 16=0.0%, 32=0.1%, 64=0.0%, >=64=0.0%
     issued rwts: total=0,8388608,0,0 short=0,0,0,0 dropped=0,0,0,0
     latency   : target=0, window=0, percentile=100.00%, depth=32
 
Run status group 0 (all jobs):
  WRITE: bw=18.6MiB/s (19.5MB/s), 18.6MiB/s-18.6MiB/s (19.5MB/s-19.5MB/s), io=32.0GiB (34.4GB), run=1758142-1758142msec
 
Disk stats (read/write):
    md7: ios=0/8388379, merge=0/0, ticks=0/0, in_queue=0, util=0.00%, aggrios=0/8305307, aggrmerge=0/84633, aggrticks=0/21623815, aggrin_queue=20873796, aggrutil=83.10%
  sde: ios=0/8304761, merge=0/85177, ticks=0/21726870, in_queue=20963144, util=83.10%
  sdd: ios=0/8305853, merge=0/84090, ticks=0/21520760, in_queue=20784448, util=82.48%
ssd_randread: (g=0): rw=randread, bs=(R) 4096B-4096B, (W) 4096B-4096B, (T) 4096B-4096B, ioengine=libaio, iodepth=32
...
fio-3.13-42-g8066f
Starting 4 processes
 
ssd_randread: (groupid=0, jobs=4): err= 0: pid=20854: Mon May 27 08:25:30 2019
  read: IOPS=98.2k, BW=384MiB/s (402MB/s)(32.0GiB/85444msec)
   bw (  KiB/s): min=302856, max=438967, per=99.99%, avg=392684.85, stdev=6920.97, samples=679
   iops        : min=75714, max=109741, avg=98171.13, stdev=1730.24, samples=679
  cpu          : usr=2.96%, sys=16.22%, ctx=1756277, majf=0, minf=160
  IO depths    : 1=0.1%, 2=0.1%, 4=0.1%, 8=0.1%, 16=0.1%, 32=100.0%, >=64=0.0%
     submit    : 0=0.0%, 4=100.0%, 8=0.0%, 16=0.0%, 32=0.0%, 64=0.0%, >=64=0.0%
     complete  : 0=0.0%, 4=100.0%, 8=0.0%, 16=0.0%, 32=0.1%, 64=0.0%, >=64=0.0%
     issued rwts: total=8388608,0,0,0 short=0,0,0,0 dropped=0,0,0,0
     latency   : target=0, window=0, percentile=100.00%, depth=32
 
Run status group 0 (all jobs):
   READ: bw=384MiB/s (402MB/s), 384MiB/s-384MiB/s (402MB/s-402MB/s), io=32.0GiB (34.4GB), run=85444-85444msec
 
Disk stats (read/write):
  sdc: ios=8375680/3, merge=7760/1, ticks=5232536/4, in_queue=2740752, util=100.00%
nvme_randread: (g=0): rw=randread, bs=(R) 4096B-4096B, (W) 4096B-4096B, (T) 4096B-4096B, ioengine=libaio, iodepth=32
...
fio-3.13-42-g8066f
Starting 4 processes
 
nvme_randread: (groupid=0, jobs=4): err= 0: pid=20883: Mon May 27 08:25:45 2019
  read: IOPS=605k, BW=2365MiB/s (2480MB/s)(32.0GiB/13855msec)
   bw (  MiB/s): min= 2348, max= 2378, per=100.00%, avg=2365.18, stdev= 1.83, samples=108
   iops        : min=601230, max=608820, avg=605485.41, stdev=468.52, samples=108
  cpu          : usr=12.96%, sys=38.88%, ctx=3673729, majf=0, minf=159
  IO depths    : 1=0.1%, 2=0.1%, 4=0.1%, 8=0.1%, 16=0.1%, 32=100.0%, >=64=0.0%
     submit    : 0=0.0%, 4=100.0%, 8=0.0%, 16=0.0%, 32=0.0%, 64=0.0%, >=64=0.0%
     complete  : 0=0.0%, 4=100.0%, 8=0.0%, 16=0.0%, 32=0.1%, 64=0.0%, >=64=0.0%
     issued rwts: total=8388608,0,0,0 short=0,0,0,0 dropped=0,0,0,0
     latency   : target=0, window=0, percentile=100.00%, depth=32
 
Run status group 0 (all jobs):
   READ: bw=2365MiB/s (2480MB/s), 2365MiB/s-2365MiB/s (2480MB/s-2480MB/s), io=32.0GiB (34.4GB), run=13855-13855msec
 
Disk stats (read/write):
  nvme0n1: ios=8263387/2, merge=0/1, ticks=1708222/0, in_queue=1893928, util=100.00%
hdd_randread: (g=0): rw=randread, bs=(R) 4096B-4096B, (W) 4096B-4096B, (T) 4096B-4096B, ioengine=libaio, iodepth=32
...
fio-3.13-42-g8066f
Starting 4 processes
 
hdd_randread: (groupid=0, jobs=4): err= 0: pid=20908: Mon May 27 09:25:46 2019
  read: IOPS=256, BW=1025KiB/s (1049kB/s)(3603MiB/3600861msec)
   bw (  KiB/s): min=  278, max= 1640, per=100.00%, avg=1024.35, stdev=30.58, samples=28804
   iops        : min=   68, max=  410, avg=255.94, stdev= 7.65, samples=28804
  cpu          : usr=0.02%, sys=0.07%, ctx=115716, majf=0, minf=163
  IO depths    : 1=0.1%, 2=0.1%, 4=0.1%, 8=0.1%, 16=0.1%, 32=100.0%, >=64=0.0%
     submit    : 0=0.0%, 4=100.0%, 8=0.0%, 16=0.0%, 32=0.0%, 64=0.0%, >=64=0.0%
     complete  : 0=0.0%, 4=100.0%, 8=0.0%, 16=0.0%, 32=0.1%, 64=0.0%, >=64=0.0%
     issued rwts: total=922360,0,0,0 short=0,0,0,0 dropped=0,0,0,0
     latency   : target=0, window=0, percentile=100.00%, depth=32
 
Run status group 0 (all jobs):
   READ: bw=1025KiB/s (1049kB/s), 1025KiB/s-1025KiB/s (1049kB/s-1049kB/s), io=3603MiB (3778MB), run=3600861-3600861msec
 
Disk stats (read/write):
  sdd: ios=922292/3, merge=27/1, ticks=217720971/727, in_queue=113860764, util=98.94%
fast-raid1_randread: (g=0): rw=randread, bs=(R) 4096B-4096B, (W) 4096B-4096B, (T) 4096B-4096B, ioengine=libaio, iodepth=32
...
fio-3.13-42-g8066f
Starting 4 processes
 
fast-raid1_randread: (groupid=0, jobs=4): err= 0: pid=21466: Mon May 27 09:26:00 2019
  read: IOPS=602k, BW=2350MiB/s (2465MB/s)(32.0GiB/13941msec)
   bw (  MiB/s): min= 2220, max= 2415, per=100.00%, avg=2354.09, stdev= 9.81, samples=108
   iops        : min=568374, max=618476, avg=602648.11, stdev=2510.22, samples=108
  cpu          : usr=10.93%, sys=52.28%, ctx=2925303, majf=0, minf=167
  IO depths    : 1=0.1%, 2=0.1%, 4=0.1%, 8=0.1%, 16=0.1%, 32=100.0%, >=64=0.0%
     submit    : 0=0.0%, 4=100.0%, 8=0.0%, 16=0.0%, 32=0.0%, 64=0.0%, >=64=0.0%
     complete  : 0=0.0%, 4=100.0%, 8=0.0%, 16=0.0%, 32=0.1%, 64=0.0%, >=64=0.0%
     issued rwts: total=8388608,0,0,0 short=0,0,0,0 dropped=0,0,0,0
     latency   : target=0, window=0, percentile=100.00%, depth=32
 
Run status group 0 (all jobs):
   READ: bw=2350MiB/s (2465MB/s), 2350MiB/s-2350MiB/s (2465MB/s-2465MB/s), io=32.0GiB (34.4GB), run=13941-13941msec
 
Disk stats (read/write):
    md4: ios=8369135/3, merge=0/0, ticks=0/0, in_queue=0, util=0.00%, aggrios=4193950/4, aggrmerge=354/1, aggrticks=857898/2, aggrin_queue=664428, aggrutil=100.00%
  sdc: ios=1367376/5, merge=708/1, ticks=868311/5, in_queue=446108, util=98.96%
  nvme0n1: ios=7020524/4, merge=0/1, ticks=847486/0, in_queue=882748, util=100.00%
fast-raid10_randread: (g=0): rw=randread, bs=(R) 4096B-4096B, (W) 4096B-4096B, (T) 4096B-4096B, ioengine=libaio, iodepth=32
...
fio-3.13-42-g8066f
Starting 4 processes
 
fast-raid10_randread: (groupid=0, jobs=4): err= 0: pid=21493: Mon May 27 09:26:41 2019
  read: IOPS=208k, BW=811MiB/s (850MB/s)(32.0GiB/40423msec)
   bw (  KiB/s): min=780328, max=899160, per=100.00%, avg=831072.62, stdev=6858.67, samples=319
   iops        : min=195082, max=224790, avg=207768.08, stdev=1714.67, samples=319
  cpu          : usr=4.65%, sys=25.53%, ctx=898971, majf=0, minf=166
  IO depths    : 1=0.1%, 2=0.1%, 4=0.1%, 8=0.1%, 16=0.1%, 32=100.0%, >=64=0.0%
     submit    : 0=0.0%, 4=100.0%, 8=0.0%, 16=0.0%, 32=0.0%, 64=0.0%, >=64=0.0%
     complete  : 0=0.0%, 4=100.0%, 8=0.0%, 16=0.0%, 32=0.1%, 64=0.0%, >=64=0.0%
     issued rwts: total=8388608,0,0,0 short=0,0,0,0 dropped=0,0,0,0
     latency   : target=0, window=0, percentile=100.00%, depth=32
 
Run status group 0 (all jobs):
   READ: bw=811MiB/s (850MB/s), 811MiB/s-811MiB/s (850MB/s-850MB/s), io=32.0GiB (34.4GB), run=40423-40423msec
 
Disk stats (read/write):
    md5: ios=8382356/4, merge=0/0, ticks=0/0, in_queue=0, util=0.00%, aggrios=4192380/10, aggrmerge=1919/1, aggrticks=1400439/5, aggrin_queue=827536, aggrutil=100.00%
  nvme0n1: ios=4420890/10, merge=0/1, ticks=340926/1, in_queue=362248, util=100.00%
  sdc: ios=3963871/11, merge=3838/1, ticks=2459952/9, in_queue=1292824, util=99.82%
slow-raid1_randread: (g=0): rw=randread, bs=(R) 4096B-4096B, (W) 4096B-4096B, (T) 4096B-4096B, ioengine=libaio, iodepth=32
...
fio-3.13-42-g8066f
Starting 4 processes
 
slow-raid1_randread: (groupid=0, jobs=4): err= 0: pid=21520: Mon May 27 10:26:42 2019
  read: IOPS=501, BW=2007KiB/s (2055kB/s)(7057MiB/3600598msec)
   bw (  KiB/s): min=  471, max= 3608, per=99.96%, avg=2006.11, stdev=90.14, samples=28804
   iops        : min=  117, max=  902, avg=501.18, stdev=22.55, samples=28804
  cpu          : usr=0.11%, sys=0.43%, ctx=976930, majf=0, minf=162
  IO depths    : 1=0.1%, 2=0.1%, 4=0.1%, 8=0.1%, 16=0.1%, 32=100.0%, >=64=0.0%
     submit    : 0=0.0%, 4=100.0%, 8=0.0%, 16=0.0%, 32=0.0%, 64=0.0%, >=64=0.0%
     complete  : 0=0.0%, 4=100.0%, 8=0.0%, 16=0.0%, 32=0.1%, 64=0.0%, >=64=0.0%
     issued rwts: total=1806648,0,0,0 short=0,0,0,0 dropped=0,0,0,0
     latency   : target=0, window=0, percentile=100.00%, depth=32
 
Run status group 0 (all jobs):
   READ: bw=2007KiB/s (2055kB/s), 2007KiB/s-2007KiB/s (2055kB/s-2055kB/s), io=7057MiB (7400MB), run=3600598-3600598msec
 
Disk stats (read/write):
    md6: ios=1806648/4, merge=0/0, ticks=0/0, in_queue=0, util=0.00%, aggrios=903297/8, aggrmerge=26/1, aggrticks=191804907/2091, aggrin_queue=110917908, aggrutil=99.11%
  sde: ios=902689/8, merge=27/1, ticks=192629122/2126, in_queue=110974004, util=99.11%
  sdd: ios=903905/8, merge=26/1, ticks=190980693/2057, in_queue=110861812, util=99.07%
slow-raid10_randread: (g=0): rw=randread, bs=(R) 4096B-4096B, (W) 4096B-4096B, (T) 4096B-4096B, ioengine=libaio, iodepth=32
...
fio-3.13-42-g8066f
Starting 4 processes
 
slow-raid10_randread: (groupid=0, jobs=4): err= 0: pid=22141: Mon May 27 11:26:43 2019
  read: IOPS=501, BW=2004KiB/s (2052kB/s)(7047MiB/3600530msec)
   bw (  KiB/s): min=  568, max= 3616, per=99.95%, avg=2002.99, stdev=89.26, samples=28801
   iops        : min=  142, max=  904, avg=500.27, stdev=22.34, samples=28801
  cpu          : usr=0.11%, sys=0.43%, ctx=981766, majf=0, minf=158
  IO depths    : 1=0.1%, 2=0.1%, 4=0.1%, 8=0.1%, 16=0.1%, 32=100.0%, >=64=0.0%
     submit    : 0=0.0%, 4=100.0%, 8=0.0%, 16=0.0%, 32=0.0%, 64=0.0%, >=64=0.0%
     complete  : 0=0.0%, 4=100.0%, 8=0.0%, 16=0.0%, 32=0.1%, 64=0.0%, >=64=0.0%
     issued rwts: total=1804024,0,0,0 short=0,0,0,0 dropped=0,0,0,0
     latency   : target=0, window=0, percentile=100.00%, depth=32
 
Run status group 0 (all jobs):
   READ: bw=2004KiB/s (2052kB/s), 2004KiB/s-2004KiB/s (2052kB/s-2052kB/s), io=7047MiB (7389MB), run=3600530-3600530msec
 
Disk stats (read/write):
    md7: ios=1804024/4, merge=0/0, ticks=0/0, in_queue=0, util=0.00%, aggrios=901984/8, aggrmerge=27/1, aggrticks=192431115/2129, aggrin_queue=111173106, aggrutil=99.17%
  sde: ios=904766/8, merge=24/1, ticks=190098507/2111, in_queue=110754216, util=99.17%
  sdd: ios=899203/8, merge=30/1, ticks=194763724/2148, in_queue=111591996, util=99.17%
ssd_randwrite: (g=0): rw=randwrite, bs=(R) 4096B-4096B, (W) 4096B-4096B, (T) 4096B-4096B, ioengine=libaio, iodepth=32
...
fio-3.13-42-g8066f
Starting 4 processes
 
ssd_randwrite: (groupid=0, jobs=4): err= 0: pid=22733: Mon May 27 11:28:21 2019
  write: IOPS=86.1k, BW=336MiB/s (353MB/s)(32.0GiB/97467msec); 0 zone resets
   bw (  KiB/s): min=317728, max=381816, per=100.00%, avg=344273.34, stdev=2458.01, samples=775
   iops        : min=79432, max=95454, avg=86068.26, stdev=614.50, samples=775
  cpu          : usr=2.91%, sys=26.62%, ctx=8245010, majf=0, minf=37
  IO depths    : 1=0.1%, 2=0.1%, 4=0.1%, 8=0.1%, 16=0.1%, 32=100.0%, >=64=0.0%
     submit    : 0=0.0%, 4=100.0%, 8=0.0%, 16=0.0%, 32=0.0%, 64=0.0%, >=64=0.0%
     complete  : 0=0.0%, 4=100.0%, 8=0.0%, 16=0.0%, 32=0.1%, 64=0.0%, >=64=0.0%
     issued rwts: total=0,8388608,0,0 short=0,0,0,0 dropped=0,0,0,0
     latency   : target=0, window=0, percentile=100.00%, depth=32
 
Run status group 0 (all jobs):
  WRITE: bw=336MiB/s (353MB/s), 336MiB/s-336MiB/s (353MB/s-353MB/s), io=32.0GiB (34.4GB), run=97467-97467msec
 
Disk stats (read/write):
  sdc: ios=0/8376016, merge=0/6243, ticks=0/5841669, in_queue=3119248, util=100.00%
nvme_randwrite: (g=0): rw=randwrite, bs=(R) 4096B-4096B, (W) 4096B-4096B, (T) 4096B-4096B, ioengine=libaio, iodepth=32
...
fio-3.13-42-g8066f
Starting 4 processes
 
nvme_randwrite: (groupid=0, jobs=4): err= 0: pid=22776: Mon May 27 11:28:41 2019
  write: IOPS=435k, BW=1698MiB/s (1780MB/s)(32.0GiB/19299msec); 0 zone resets
   bw (  MiB/s): min= 1668, max= 1727, per=100.00%, avg=1697.90, stdev= 3.49, samples=152
   iops        : min=427190, max=442344, avg=434663.08, stdev=894.54, samples=152
  cpu          : usr=10.11%, sys=53.60%, ctx=1691030, majf=0, minf=38
  IO depths    : 1=0.1%, 2=0.1%, 4=0.1%, 8=0.1%, 16=0.1%, 32=100.0%, >=64=0.0%
     submit    : 0=0.0%, 4=100.0%, 8=0.0%, 16=0.0%, 32=0.0%, 64=0.0%, >=64=0.0%
     complete  : 0=0.0%, 4=100.0%, 8=0.0%, 16=0.0%, 32=0.1%, 64=0.0%, >=64=0.0%
     issued rwts: total=0,8388608,0,0 short=0,0,0,0 dropped=0,0,0,0
     latency   : target=0, window=0, percentile=100.00%, depth=32
 
Run status group 0 (all jobs):
  WRITE: bw=1698MiB/s (1780MB/s), 1698MiB/s-1698MiB/s (1780MB/s-1780MB/s), io=32.0GiB (34.4GB), run=19299-19299msec
 
Disk stats (read/write):
  nvme0n1: ios=0/8322950, merge=0/3, ticks=0/2255895, in_queue=2510004, util=100.00%
hdd_randwrite: (g=0): rw=randwrite, bs=(R) 4096B-4096B, (W) 4096B-4096B, (T) 4096B-4096B, ioengine=libaio, iodepth=32
...
fio-3.13-42-g8066f
Starting 4 processes
 
hdd_randwrite: (groupid=0, jobs=4): err= 0: pid=22802: Mon May 27 12:28:52 2019
  write: IOPS=74, BW=298KiB/s (305kB/s)(1051MiB/3610638msec); 0 zone resets
   bw (  KiB/s): min=   28, max=11138, per=100.00%, avg=1200.85, stdev=596.45, samples=7165
   iops        : min=    4, max= 2784, avg=300.01, stdev=149.12, samples=7165
  cpu          : usr=0.01%, sys=0.07%, ctx=141548, majf=0, minf=34
  IO depths    : 1=0.1%, 2=0.1%, 4=0.1%, 8=0.1%, 16=0.1%, 32=100.0%, >=64=0.0%
     submit    : 0=0.0%, 4=100.0%, 8=0.0%, 16=0.0%, 32=0.0%, 64=0.0%, >=64=0.0%
     complete  : 0=0.0%, 4=100.0%, 8=0.0%, 16=0.0%, 32=0.1%, 64=0.0%, >=64=0.0%
     issued rwts: total=0,269048,0,0 short=0,0,0,0 dropped=0,0,0,0
     latency   : target=0, window=0, percentile=100.00%, depth=32
 
Run status group 0 (all jobs):
  WRITE: bw=298KiB/s (305kB/s), 298KiB/s-298KiB/s (305kB/s-305kB/s), io=1051MiB (1102MB), run=3610638-3610638msec
 
Disk stats (read/write):
  sdd: ios=0/269976, merge=0/476, ticks=0/201913479, in_queue=12552396, util=13.33%
fast-raid1_randwrite: (g=0): rw=randwrite, bs=(R) 4096B-4096B, (W) 4096B-4096B, (T) 4096B-4096B, ioengine=libaio, iodepth=32
...
fio-3.13-42-g8066f
Starting 4 processes
 
fast-raid1_randwrite: (groupid=0, jobs=4): err= 0: pid=23340: Mon May 27 12:30:35 2019
  write: IOPS=82.2k, BW=321MiB/s (337MB/s)(32.0GiB/102044msec); 0 zone resets
   bw (  KiB/s): min=310456, max=366517, per=100.00%, avg=328899.58, stdev=1230.46, samples=811
   iops        : min=77614, max=91629, avg=82224.78, stdev=307.61, samples=811
  cpu          : usr=2.49%, sys=34.63%, ctx=970337, majf=0, minf=35
  IO depths    : 1=0.1%, 2=0.1%, 4=0.1%, 8=0.1%, 16=0.1%, 32=100.0%, >=64=0.0%
     submit    : 0=0.0%, 4=100.0%, 8=0.0%, 16=0.0%, 32=0.0%, 64=0.0%, >=64=0.0%
     complete  : 0=0.0%, 4=100.0%, 8=0.0%, 16=0.0%, 32=0.1%, 64=0.0%, >=64=0.0%
     issued rwts: total=0,8388608,0,0 short=0,0,0,0 dropped=0,0,0,0
     latency   : target=0, window=0, percentile=100.00%, depth=32
 
Run status group 0 (all jobs):
  WRITE: bw=321MiB/s (337MB/s), 321MiB/s-321MiB/s (337MB/s-337MB/s), io=32.0GiB (34.4GB), run=102044-102044msec
 
Disk stats (read/write):
    md4: ios=0/8376311, merge=0/0, ticks=0/0, in_queue=0, util=0.00%, aggrios=0/8388659, aggrmerge=0/20, aggrticks=0/704846, aggrin_queue=735954, aggrutil=100.00%
  sdc: ios=0/8388669, merge=0/20, ticks=0/1287644, in_queue=1244548, util=98.44%
  nvme0n1: ios=0/8388649, merge=0/20, ticks=0/122048, in_queue=227360, util=100.00%
fast-raid10_randwrite: (g=0): rw=randwrite, bs=(R) 4096B-4096B, (W) 4096B-4096B, (T) 4096B-4096B, ioengine=libaio, iodepth=32
...
fio-3.13-42-g8066f
Starting 4 processes
 
fast-raid10_randwrite: (groupid=0, jobs=4): err= 0: pid=23379: Mon May 27 12:32:17 2019
  write: IOPS=82.2k, BW=321MiB/s (337MB/s)(32.0GiB/102002msec); 0 zone resets
   bw (  KiB/s): min=310944, max=407752, per=100.00%, avg=329334.69, stdev=2083.52, samples=810
   iops        : min=77736, max=101937, avg=82333.63, stdev=520.86, samples=810
  cpu          : usr=2.41%, sys=35.05%, ctx=960868, majf=0, minf=31
  IO depths    : 1=0.1%, 2=0.1%, 4=0.1%, 8=0.1%, 16=0.1%, 32=100.0%, >=64=0.0%
     submit    : 0=0.0%, 4=100.0%, 8=0.0%, 16=0.0%, 32=0.0%, 64=0.0%, >=64=0.0%
     complete  : 0=0.0%, 4=100.0%, 8=0.0%, 16=0.0%, 32=0.1%, 64=0.0%, >=64=0.0%
     issued rwts: total=0,8388608,0,0 short=0,0,0,0 dropped=0,0,0,0
     latency   : target=0, window=0, percentile=100.00%, depth=32
 
Run status group 0 (all jobs):
  WRITE: bw=321MiB/s (337MB/s), 321MiB/s-321MiB/s (337MB/s-337MB/s), io=32.0GiB (34.4GB), run=102002-102002msec
 
Disk stats (read/write):
    md5: ios=0/8379512, merge=0/0, ticks=0/0, in_queue=0, util=0.00%, aggrios=0/8388666, aggrmerge=0/21, aggrticks=0/704190, aggrin_queue=738060, aggrutil=100.00%
  nvme0n1: ios=0/8388656, merge=0/21, ticks=0/121112, in_queue=220276, util=100.00%
  sdc: ios=0/8388677, merge=0/21, ticks=0/1287268, in_queue=1255844, util=98.63%
slow-raid1_randwrite: (g=0): rw=randwrite, bs=(R) 4096B-4096B, (W) 4096B-4096B, (T) 4096B-4096B, ioengine=libaio, iodepth=32
...
fio-3.13-42-g8066f
Starting 4 processes
 
slow-raid1_randwrite: (groupid=0, jobs=4): err= 0: pid=23420: Mon May 27 13:32:27 2019
  write: IOPS=25, BW=100KiB/s (102kB/s)(352MiB/3608832msec); 0 zone resets
   bw (  KiB/s): min=   28, max= 7240, per=100.00%, avg=281.88, stdev=142.99, samples=10204
   iops        : min=    4, max= 1810, avg=70.09, stdev=35.76, samples=10204
  cpu          : usr=0.00%, sys=0.03%, ctx=27556, majf=0, minf=30
  IO depths    : 1=0.1%, 2=0.1%, 4=0.1%, 8=0.1%, 16=0.1%, 32=99.9%, >=64=0.0%
     submit    : 0=0.0%, 4=100.0%, 8=0.0%, 16=0.0%, 32=0.0%, 64=0.0%, >=64=0.0%
     complete  : 0=0.0%, 4=100.0%, 8=0.0%, 16=0.0%, 32=0.1%, 64=0.0%, >=64=0.0%
     issued rwts: total=0,90232,0,0 short=0,0,0,0 dropped=0,0,0,0
     latency   : target=0, window=0, percentile=100.00%, depth=32
 
Run status group 0 (all jobs):
  WRITE: bw=100KiB/s (102kB/s), 100KiB/s-100KiB/s (102kB/s-102kB/s), io=352MiB (370MB), run=3608832-3608832msec
 
Disk stats (read/write):
    md6: ios=0/91688, merge=0/0, ticks=0/0, in_queue=0, util=0.00%, aggrios=0/91744, aggrmerge=0/497, aggrticks=0/44113055, aggrin_queue=4778486, aggrutil=14.52%
  sde: ios=0/91740, merge=0/502, ticks=0/7593320, in_queue=354720, util=1.31%
  sdd: ios=0/91749, merge=0/493, ticks=0/80632791, in_queue=9202252, util=14.52%
slow-raid10_randwrite: (g=0): rw=randwrite, bs=(R) 4096B-4096B, (W) 4096B-4096B, (T) 4096B-4096B, ioengine=libaio, iodepth=32
...
fio-3.13-42-g8066f
Starting 4 processes
 
slow-raid10_randwrite: (groupid=0, jobs=4): err= 0: pid=23949: Mon May 27 14:32:34 2019
  write: IOPS=21, BW=85.6KiB/s (87.6kB/s)(301MiB/3606668msec); 0 zone resets
   bw (  KiB/s): min=   28, max= 4784, per=100.00%, avg=229.85, stdev=74.19, samples=10698
   iops        : min=    4, max= 1196, avg=57.11, stdev=18.56, samples=10698
  cpu          : usr=0.00%, sys=0.03%, ctx=25045, majf=0, minf=34
  IO depths    : 1=0.1%, 2=0.1%, 4=0.1%, 8=0.1%, 16=0.1%, 32=99.8%, >=64=0.0%
     submit    : 0=0.0%, 4=100.0%, 8=0.0%, 16=0.0%, 32=0.0%, 64=0.0%, >=64=0.0%
     complete  : 0=0.0%, 4=100.0%, 8=0.0%, 16=0.0%, 32=0.1%, 64=0.0%, >=64=0.0%
     issued rwts: total=0,77176,0,0 short=0,0,0,0 dropped=0,0,0,0
     latency   : target=0, window=0, percentile=100.00%, depth=32
 
Run status group 0 (all jobs):
  WRITE: bw=85.6KiB/s (87.6kB/s), 85.6KiB/s-85.6KiB/s (87.6kB/s-87.6kB/s), io=301MiB (316MB), run=3606668-3606668msec
 
Disk stats (read/write):
    md7: ios=0/78691, merge=0/0, ticks=0/0, in_queue=0, util=0.00%, aggrios=0/78719, aggrmerge=0/506, aggrticks=0/43822275, aggrin_queue=5006454, aggrutil=15.52%
  sde: ios=0/78716, merge=0/510, ticks=0/6980884, in_queue=264756, util=1.18%
  sdd: ios=0/78723, merge=0/503, ticks=0/80663667, in_queue=9748152, util=15.52%
ssd_rand40read: (g=0): rw=randrw, bs=(R) 4096B-4096B, (W) 4096B-4096B, (T) 4096B-4096B, ioengine=libaio, iodepth=32
...
fio-3.13-42-g8066f
Starting 4 processes
 
 
ssd_rand40read: (groupid=0, jobs=4): err= 0: pid=24459: Mon May 27 14:34:07 2019
  read: IOPS=36.3k, BW=142MiB/s (148MB/s)(12.8GiB/92604msec)
   bw (  KiB/s): min=137354, max=157789, per=99.98%, avg=144980.14, stdev=914.61, samples=736
   iops        : min=34338, max=39447, avg=36244.96, stdev=228.66, samples=736
  write: IOPS=54.3k, BW=212MiB/s (223MB/s)(19.2GiB/92604msec); 0 zone resets
   bw (  KiB/s): min=207912, max=235496, per=99.98%, avg=217284.77, stdev=1277.34, samples=736
   iops        : min=51978, max=58874, avg=54321.11, stdev=319.33, samples=736
  cpu          : usr=3.47%, sys=23.54%, ctx=7633204, majf=0, minf=39
  IO depths    : 1=0.1%, 2=0.1%, 4=0.1%, 8=0.1%, 16=0.1%, 32=100.0%, >=64=0.0%
     submit    : 0=0.0%, 4=100.0%, 8=0.0%, 16=0.0%, 32=0.0%, 64=0.0%, >=64=0.0%
     complete  : 0=0.0%, 4=100.0%, 8=0.0%, 16=0.0%, 32=0.1%, 64=0.0%, >=64=0.0%
     issued rwts: total=3357227,5031381,0,0 short=0,0,0,0 dropped=0,0,0,0
     latency   : target=0, window=0, percentile=100.00%, depth=32
 
Run status group 0 (all jobs):
   READ: bw=142MiB/s (148MB/s), 142MiB/s-142MiB/s (148MB/s-148MB/s), io=12.8GiB (13.8GB), run=92604-92604msec
  WRITE: bw=212MiB/s (223MB/s), 212MiB/s-212MiB/s (223MB/s-223MB/s), io=19.2GiB (20.6GB), run=92604-92604msec
 
Disk stats (read/write):
  sdc: ios=3348978/5017641, merge=412/1987, ticks=1832516/3506648, in_queue=2964760, util=100.00%
nvme_rand40read: (g=0): rw=randrw, bs=(R) 4096B-4096B, (W) 4096B-4096B, (T) 4096B-4096B, ioengine=libaio, iodepth=32
...
fio-3.13-42-g8066f
Starting 4 processes
 
nvme_rand40read: (groupid=0, jobs=4): err= 0: pid=24494: Mon May 27 14:34:28 2019
  read: IOPS=168k, BW=655MiB/s (687MB/s)(12.8GiB/20018msec)
   bw (  KiB/s): min=648952, max=688768, per=100.00%, avg=671058.81, stdev=2513.53, samples=159
   iops        : min=162238, max=172192, avg=167764.64, stdev=628.37, samples=159
  write: IOPS=251k, BW=982MiB/s (1030MB/s)(19.2GiB/20018msec); 0 zone resets
   bw (  KiB/s): min=974008, max=1030368, per=100.00%, avg=1005678.16, stdev=3716.60, samples=159
   iops        : min=243502, max=257592, avg=251419.50, stdev=929.15, samples=159
  cpu          : usr=8.58%, sys=46.68%, ctx=6081666, majf=0, minf=37
  IO depths    : 1=0.1%, 2=0.1%, 4=0.1%, 8=0.1%, 16=0.1%, 32=100.0%, >=64=0.0%
     submit    : 0=0.0%, 4=100.0%, 8=0.0%, 16=0.0%, 32=0.0%, 64=0.0%, >=64=0.0%
     complete  : 0=0.0%, 4=100.0%, 8=0.0%, 16=0.0%, 32=0.1%, 64=0.0%, >=64=0.0%
     issued rwts: total=3357227,5031381,0,0 short=0,0,0,0 dropped=0,0,0,0
     latency   : target=0, window=0, percentile=100.00%, depth=32
 
Run status group 0 (all jobs):
   READ: bw=655MiB/s (687MB/s), 655MiB/s-655MiB/s (687MB/s-687MB/s), io=12.8GiB (13.8GB), run=20018-20018msec
  WRITE: bw=982MiB/s (1030MB/s), 982MiB/s-982MiB/s (1030MB/s-1030MB/s), io=19.2GiB (20.6GB), run=20018-20018msec
 
Disk stats (read/write):
  nvme0n1: ios=3337290/5001689, merge=0/3, ticks=1181649/890715, in_queue=2237796, util=100.00%
hdd_rand40read: (g=0): rw=randrw, bs=(R) 4096B-4096B, (W) 4096B-4096B, (T) 4096B-4096B, ioengine=libaio, iodepth=32
...
fio-3.13-42-g8066f
Starting 4 processes
 
hdd_rand40read: (groupid=0, jobs=4): err= 0: pid=24517: Mon May 27 15:34:29 2019
  read: IOPS=19, BW=77.5KiB/s (79.3kB/s)(273MiB/3601333msec)
   bw (  KiB/s): min=   28, max= 1016, per=100.00%, avg=184.05, stdev=37.32, samples=12089
   iops        : min=    4, max=  254, avg=45.65, stdev= 9.33, samples=12089
  write: IOPS=29, BW=116KiB/s (119kB/s)(408MiB/3601333msec); 0 zone resets
   bw (  KiB/s): min=   28, max= 1518, per=100.00%, avg=246.94, stdev=53.96, samples=13515
   iops        : min=    4, max=  378, avg=61.37, stdev=13.48, samples=13515
  cpu          : usr=0.01%, sys=0.04%, ctx=147402, majf=0, minf=34
  IO depths    : 1=0.1%, 2=0.1%, 4=0.1%, 8=0.1%, 16=0.1%, 32=99.9%, >=64=0.0%
     submit    : 0=0.0%, 4=100.0%, 8=0.0%, 16=0.0%, 32=0.0%, 64=0.0%, >=64=0.0%
     complete  : 0=0.0%, 4=100.0%, 8=0.0%, 16=0.0%, 32=0.1%, 64=0.0%, >=64=0.0%
     issued rwts: total=69764,104564,0,0 short=0,0,0,0 dropped=0,0,0,0
     latency   : target=0, window=0, percentile=100.00%, depth=32
 
Run status group 0 (all jobs):
   READ: bw=77.5KiB/s (79.3kB/s), 77.5KiB/s-77.5KiB/s (79.3kB/s-79.3kB/s), io=273MiB (286MB), run=3601333-3601333msec
  WRITE: bw=116KiB/s (119kB/s), 116KiB/s-116KiB/s (119kB/s-119kB/s), io=408MiB (428MB), run=3601333-3601333msec
 
Disk stats (read/write):
  sdd: ios=69754/105816, merge=0/638, ticks=60387351/139632687, in_queue=34094648, util=38.38%
fast-raid1_rand40read: (g=0): rw=randrw, bs=(R) 4096B-4096B, (W) 4096B-4096B, (T) 4096B-4096B, ioengine=libaio, iodepth=32
...
fio-3.13-42-g8066f
Starting 4 processes
 
fast-raid1_rand40read: (groupid=0, jobs=4): err= 0: pid=24996: Mon May 27 15:35:33 2019
  read: IOPS=53.6k, BW=210MiB/s (220MB/s)(12.8GiB/62577msec)
   bw (  KiB/s): min=203040, max=225448, per=99.99%, avg=214565.85, stdev=864.07, samples=496
   iops        : min=50760, max=56362, avg=53641.38, stdev=216.01, samples=496
  write: IOPS=80.4k, BW=314MiB/s (329MB/s)(19.2GiB/62577msec); 0 zone resets
   bw (  KiB/s): min=306304, max=334360, per=99.99%, avg=321567.38, stdev=960.94, samples=496
   iops        : min=76576, max=83590, avg=80391.76, stdev=240.24, samples=496
  cpu          : usr=3.93%, sys=38.31%, ctx=6189944, majf=0, minf=31
  IO depths    : 1=0.1%, 2=0.1%, 4=0.1%, 8=0.1%, 16=0.1%, 32=100.0%, >=64=0.0%
     submit    : 0=0.0%, 4=100.0%, 8=0.0%, 16=0.0%, 32=0.0%, 64=0.0%, >=64=0.0%
     complete  : 0=0.0%, 4=100.0%, 8=0.0%, 16=0.0%, 32=0.1%, 64=0.0%, >=64=0.0%
     issued rwts: total=3357227,5031381,0,0 short=0,0,0,0 dropped=0,0,0,0
     latency   : target=0, window=0, percentile=100.00%, depth=32
 
Run status group 0 (all jobs):
   READ: bw=210MiB/s (220MB/s), 210MiB/s-210MiB/s (220MB/s-220MB/s), io=12.8GiB (13.8GB), run=62577-62577msec
  WRITE: bw=314MiB/s (329MB/s), 314MiB/s-314MiB/s (329MB/s-329MB/s), io=19.2GiB (20.6GB), run=62577-62577msec
 
Disk stats (read/write):
    md4: ios=3347484/5016809, merge=0/0, ticks=0/0, in_queue=0, util=0.00%, aggrios=1678613/5031412, aggrmerge=0/12, aggrticks=203582/449275, aggrin_queue=667070, aggrutil=100.00%
  sdc: ios=214068/5031418, merge=0/12, ticks=55301/827759, in_queue=870720, util=99.41%
  nvme0n1: ios=3143159/5031406, merge=0/12, ticks=351863/70792, in_queue=463420, util=100.00%
fast-raid10_rand40read: (g=0): rw=randrw, bs=(R) 4096B-4096B, (W) 4096B-4096B, (T) 4096B-4096B, ioengine=libaio, iodepth=32
...
fio-3.13-42-g8066f
Starting 4 processes
 
fast-raid10_rand40read: (groupid=0, jobs=4): err= 0: pid=25027: Mon May 27 15:36:50 2019
  read: IOPS=43.6k, BW=170MiB/s (178MB/s)(12.8GiB/77071msec)
   bw (  KiB/s): min=165472, max=184784, per=99.99%, avg=174214.65, stdev=1009.55, samples=612
   iops        : min=41368, max=46196, avg=43553.61, stdev=252.39, samples=612
  write: IOPS=65.3k, BW=255MiB/s (267MB/s)(19.2GiB/77071msec); 0 zone resets
   bw (  KiB/s): min=250816, max=274536, per=99.99%, avg=261091.16, stdev=1363.52, samples=612
   iops        : min=62704, max=68634, avg=65272.73, stdev=340.88, samples=612
  cpu          : usr=3.59%, sys=34.08%, ctx=6235718, majf=0, minf=37
  IO depths    : 1=0.1%, 2=0.1%, 4=0.1%, 8=0.1%, 16=0.1%, 32=100.0%, >=64=0.0%
     submit    : 0=0.0%, 4=100.0%, 8=0.0%, 16=0.0%, 32=0.0%, 64=0.0%, >=64=0.0%
     complete  : 0=0.0%, 4=100.0%, 8=0.0%, 16=0.0%, 32=0.1%, 64=0.0%, >=64=0.0%
     issued rwts: total=3357227,5031381,0,0 short=0,0,0,0 dropped=0,0,0,0
     latency   : target=0, window=0, percentile=100.00%, depth=32
 
Run status group 0 (all jobs):
   READ: bw=170MiB/s (178MB/s), 170MiB/s-170MiB/s (178MB/s-178MB/s), io=12.8GiB (13.8GB), run=77071-77071msec
  WRITE: bw=255MiB/s (267MB/s), 255MiB/s-255MiB/s (267MB/s-267MB/s), io=19.2GiB (20.6GB), run=77071-77071msec
 
Disk stats (read/write):
    md5: ios=3349230/5019464, merge=0/0, ticks=0/0, in_queue=0, util=0.00%, aggrios=1678605/5031368, aggrmerge=7/75, aggrticks=375482/535122, aggrin_queue=907140, aggrutil=100.00%
  nvme0n1: ios=1683181/5031419, merge=0/16, ticks=173697/68306, in_queue=286432, util=100.00%
  sdc: ios=1674030/5031317, merge=15/134, ticks=577268/1001938, in_queue=1527848, util=100.00%
slow-raid1_rand40read: (g=0): rw=randrw, bs=(R) 4096B-4096B, (W) 4096B-4096B, (T) 4096B-4096B, ioengine=libaio, iodepth=32
...
fio-3.13-42-g8066f
Starting 4 processes
 
slow-raid1_rand40read: (groupid=0, jobs=4): err= 0: pid=25058: Mon May 27 16:36:51 2019
  read: IOPS=25, BW=102KiB/s (104kB/s)(359MiB/3600363msec)
   bw (  KiB/s): min=   28, max= 1567, per=100.00%, avg=190.82, stdev=48.94, samples=15352
   iops        : min=    4, max=  391, avg=47.44, stdev=12.23, samples=15352
  write: IOPS=38, BW=154KiB/s (157kB/s)(540MiB/3600363msec); 0 zone resets
   bw (  KiB/s): min=   28, max= 2408, per=100.00%, avg=262.88, stdev=75.86, samples=16781
   iops        : min=    4, max=  602, avg=65.46, stdev=18.96, samples=16781
  cpu          : usr=0.01%, sys=0.07%, ctx=170981, majf=0, minf=36
  IO depths    : 1=0.1%, 2=0.1%, 4=0.1%, 8=0.1%, 16=0.1%, 32=99.9%, >=64=0.0%
     submit    : 0=0.0%, 4=100.0%, 8=0.0%, 16=0.0%, 32=0.0%, 64=0.0%, >=64=0.0%
     complete  : 0=0.0%, 4=100.0%, 8=0.0%, 16=0.0%, 32=0.1%, 64=0.0%, >=64=0.0%
     issued rwts: total=91801,138207,0,0 short=0,0,0,0 dropped=0,0,0,0
     latency   : target=0, window=0, percentile=100.00%, depth=32
 
Run status group 0 (all jobs):
   READ: bw=102KiB/s (104kB/s), 102KiB/s-102KiB/s (104kB/s-104kB/s), io=359MiB (376MB), run=3600363-3600363msec
  WRITE: bw=154KiB/s (157kB/s), 154KiB/s-154KiB/s (157kB/s-157kB/s), io=540MiB (566MB), run=3600363-3600363msec
 
Disk stats (read/write):
    md6: ios=91779/140158, merge=0/0, ticks=0/0, in_queue=0, util=0.00%, aggrios=45900/140208, aggrmerge=0/656, aggrticks=14202214/30211957, aggrin_queue=12491444, aggrutil=48.18%
  sde: ios=39664/140200, merge=0/664, ticks=2840484/5209092, in_queue=2804348, util=9.82%
  sdd: ios=52137/140216, merge=0/648, ticks=25563944/55214822, in_queue=22178540, util=48.18%
slow-raid10_rand40read: (g=0): rw=randrw, bs=(R) 4096B-4096B, (W) 4096B-4096B, (T) 4096B-4096B, ioengine=libaio, iodepth=32
...
fio-3.13-42-g8066f
Starting 4 processes
 
slow-raid10_rand40read: (groupid=0, jobs=4): err= 0: pid=25714: Mon May 27 17:37:04 2019
  read: IOPS=17, BW=70.0KiB/s (71.7kB/s)(247MiB/3612868msec)
   bw (  KiB/s): min=   27, max= 1216, per=100.00%, avg=162.19, stdev=41.06, samples=12423
   iops        : min=    4, max=  304, avg=40.09, stdev=10.27, samples=12423
  write: IOPS=26, BW=105KiB/s (108kB/s)(371MiB/3612868msec); 0 zone resets
   bw (  KiB/s): min=   27, max= 2024, per=100.00%, avg=223.10, stdev=64.70, samples=13569
   iops        : min=    4, max=  506, avg=55.32, stdev=16.17, samples=13569
  cpu          : usr=0.01%, sys=0.05%, ctx=122921, majf=0, minf=39
  IO depths    : 1=0.1%, 2=0.1%, 4=0.1%, 8=0.1%, 16=0.1%, 32=99.9%, >=64=0.0%
     submit    : 0=0.0%, 4=100.0%, 8=0.0%, 16=0.0%, 32=0.0%, 64=0.0%, >=64=0.0%
     complete  : 0=0.0%, 4=100.0%, 8=0.0%, 16=0.0%, 32=0.1%, 64=0.0%, >=64=0.0%
     issued rwts: total=63249,94951,0,0 short=0,0,0,0 dropped=0,0,0,0
     latency   : target=0, window=0, percentile=100.00%, depth=32
 
Run status group 0 (all jobs):
   READ: bw=70.0KiB/s (71.7kB/s), 70.0KiB/s-70.0KiB/s (71.7kB/s-71.7kB/s), io=247MiB (259MB), run=3612868-3612868msec
  WRITE: bw=105KiB/s (108kB/s), 105KiB/s-105KiB/s (108kB/s-108kB/s), io=371MiB (389MB), run=3612868-3612868msec
 
Disk stats (read/write):
    md7: ios=63249/96781, merge=0/0, ticks=0/0, in_queue=0, util=0.00%, aggrios=31624/96881, aggrmerge=0/522, aggrticks=15497107/37413184, aggrin_queue=10284966, aggrutil=35.60%
  sde: ios=27131/96796, merge=0/608, ticks=8770894/25815301, in_queue=5907956, util=18.62%
  sdd: ios=36118/96966, merge=0/436, ticks=22223321/49011067, in_queue=14661976, util=35.60%
ssd_rand75read: (g=0): rw=randrw, bs=(R) 4096B-4096B, (W) 4096B-4096B, (T) 4096B-4096B, ioengine=libaio, iodepth=32
...
fio-3.13-42-g8066f
Starting 4 processes
 
ssd_rand75read: (groupid=0, jobs=4): err= 0: pid=26527: Mon May 27 17:38:33 2019
  read: IOPS=71.0k, BW=278MiB/s (291MB/s)(23.0GiB/88532msec)
   bw (  KiB/s): min=255176, max=491472, per=100.00%, avg=287151.98, stdev=8804.16, samples=697
   iops        : min=63794, max=122866, avg=71787.92, stdev=2201.03, samples=697
  write: IOPS=23.7k, BW=92.6MiB/s (97.1MB/s)(8198MiB/88532msec); 0 zone resets
   bw (  KiB/s): min=83320, max=165016, per=100.00%, avg=95816.08, stdev=2959.11, samples=697
   iops        : min=20830, max=41254, avg=23953.99, stdev=739.78, samples=697
  cpu          : usr=3.84%, sys=20.61%, ctx=5531570, majf=0, minf=34
  IO depths    : 1=0.1%, 2=0.1%, 4=0.1%, 8=0.1%, 16=0.1%, 32=100.0%, >=64=0.0%
     submit    : 0=0.0%, 4=100.0%, 8=0.0%, 16=0.0%, 32=0.0%, 64=0.0%, >=64=0.0%
     complete  : 0=0.0%, 4=100.0%, 8=0.0%, 16=0.0%, 32=0.1%, 64=0.0%, >=64=0.0%
     issued rwts: total=6290017,2098591,0,0 short=0,0,0,0 dropped=0,0,0,0
     latency   : target=0, window=0, percentile=100.00%, depth=32
 
Run status group 0 (all jobs):
   READ: bw=278MiB/s (291MB/s), 278MiB/s-278MiB/s (291MB/s-291MB/s), io=23.0GiB (25.8GB), run=88532-88532msec
  WRITE: bw=92.6MiB/s (97.1MB/s), 92.6MiB/s-92.6MiB/s (97.1MB/s-97.1MB/s), io=8198MiB (8596MB), run=88532-88532msec
 
Disk stats (read/write):
  sdc: ios=6276704/2094912, merge=3430/421, ticks=3570460/1234860, in_queue=2836220, util=100.00%
nvme_rand75read: (g=0): rw=randrw, bs=(R) 4096B-4096B, (W) 4096B-4096B, (T) 4096B-4096B, ioengine=libaio, iodepth=32
...
fio-3.13-42-g8066f
Starting 4 processes
 
nvme_rand75read: (groupid=0, jobs=4): err= 0: pid=26568: Mon May 27 17:38:52 2019
  read: IOPS=340k, BW=1327MiB/s (1391MB/s)(23.0GiB/18522msec)
   bw (  MiB/s): min= 1294, max= 1356, per=100.00%, avg=1326.84, stdev= 4.07, samples=147
   iops        : min=331282, max=347170, avg=339670.68, stdev=1041.42, samples=147
  write: IOPS=113k, BW=443MiB/s (464MB/s)(8198MiB/18522msec); 0 zone resets
   bw (  KiB/s): min=438432, max=465144, per=100.00%, avg=453358.86, stdev=1646.16, samples=147
   iops        : min=109608, max=116286, avg=113339.71, stdev=411.56, samples=147
  cpu          : usr=10.14%, sys=46.86%, ctx=5103055, majf=0, minf=40
  IO depths    : 1=0.1%, 2=0.1%, 4=0.1%, 8=0.1%, 16=0.1%, 32=100.0%, >=64=0.0%
     submit    : 0=0.0%, 4=100.0%, 8=0.0%, 16=0.0%, 32=0.0%, 64=0.0%, >=64=0.0%
     complete  : 0=0.0%, 4=100.0%, 8=0.0%, 16=0.0%, 32=0.1%, 64=0.0%, >=64=0.0%
     issued rwts: total=6290017,2098591,0,0 short=0,0,0,0 dropped=0,0,0,0
     latency   : target=0, window=0, percentile=100.00%, depth=32
 
Run status group 0 (all jobs):
   READ: bw=1327MiB/s (1391MB/s), 1327MiB/s-1327MiB/s (1391MB/s-1391MB/s), io=23.0GiB (25.8GB), run=18522-18522msec
  WRITE: bw=443MiB/s (464MB/s), 443MiB/s-443MiB/s (464MB/s-464MB/s), io=8198MiB (8596MB), run=18522-18522msec
 
Disk stats (read/write):
  nvme0n1: ios=6248647/2084929, merge=0/3, ticks=1873327/160609, in_queue=2202800, util=100.00%
hdd_rand75read: (g=0): rw=randrw, bs=(R) 4096B-4096B, (W) 4096B-4096B, (T) 4096B-4096B, ioengine=libaio, iodepth=32
...
fio-3.13-42-g8066f
Starting 4 processes
 
hdd_rand75read: (groupid=0, jobs=4): err= 0: pid=26596: Mon May 27 18:38:55 2019
  read: IOPS=56, BW=226KiB/s (231kB/s)(794MiB/3602251msec)
   bw (  KiB/s): min=   28, max= 1448, per=100.00%, avg=418.58, stdev=77.89, samples=15527
   iops        : min=    4, max=  362, avg=104.55, stdev=19.47, samples=15527
  write: IOPS=18, BW=75.6KiB/s (77.4kB/s)(266MiB/3602251msec); 0 zone resets
   bw (  KiB/s): min=   28, max=  728, per=100.00%, avg=171.33, stdev=30.27, samples=12702
   iops        : min=    4, max=  182, avg=42.73, stdev= 7.57, samples=12702
  cpu          : usr=0.01%, sys=0.05%, ctx=186498, majf=0, minf=39
  IO depths    : 1=0.1%, 2=0.1%, 4=0.1%, 8=0.1%, 16=0.1%, 32=100.0%, >=64=0.0%
     submit    : 0=0.0%, 4=100.0%, 8=0.0%, 16=0.0%, 32=0.0%, 64=0.0%, >=64=0.0%
     complete  : 0=0.0%, 4=100.0%, 8=0.0%, 16=0.0%, 32=0.1%, 64=0.0%, >=64=0.0%
     issued rwts: total=203244,68108,0,0 short=0,0,0,0 dropped=0,0,0,0
     latency   : target=0, window=0, percentile=100.00%, depth=32
 
Run status group 0 (all jobs):
   READ: bw=226KiB/s (231kB/s), 226KiB/s-226KiB/s (231kB/s-231kB/s), io=794MiB (832MB), run=3602251-3602251msec
  WRITE: bw=75.6KiB/s (77.4kB/s), 75.6KiB/s-75.6KiB/s (77.4kB/s-77.4kB/s), io=266MiB (279MB), run=3602251-3602251msec
 
Disk stats (read/write):
  sdd: ios=203238/69356, merge=3/630, ticks=136092993/55058765, in_queue=45116208, util=48.88%
fast-raid1_rand75read: (g=0): rw=randrw, bs=(R) 4096B-4096B, (W) 4096B-4096B, (T) 4096B-4096B, ioengine=libaio, iodepth=32
...
fio-3.13-42-g8066f
Starting 4 processes
 
fast-raid1_rand75read: (groupid=0, jobs=4): err= 0: pid=27367: Mon May 27 18:39:32 2019
  read: IOPS=176k, BW=686MiB/s (719MB/s)(23.0GiB/35835msec)
   bw (  KiB/s): min=660240, max=717336, per=99.98%, avg=701957.38, stdev=2252.52, samples=284
   iops        : min=165060, max=179334, avg=175489.34, stdev=563.13, samples=284
  write: IOPS=58.6k, BW=229MiB/s (240MB/s)(8198MiB/35835msec); 0 zone resets
   bw (  KiB/s): min=222680, max=240808, per=100.00%, avg=234241.37, stdev=724.34, samples=284
   iops        : min=55670, max=60202, avg=58560.31, stdev=181.09, samples=284
  cpu          : usr=5.87%, sys=43.43%, ctx=4398551, majf=0, minf=35
  IO depths    : 1=0.1%, 2=0.1%, 4=0.1%, 8=0.1%, 16=0.1%, 32=100.0%, >=64=0.0%
     submit    : 0=0.0%, 4=100.0%, 8=0.0%, 16=0.0%, 32=0.0%, 64=0.0%, >=64=0.0%
     complete  : 0=0.0%, 4=100.0%, 8=0.0%, 16=0.0%, 32=0.1%, 64=0.0%, >=64=0.0%
     issued rwts: total=6290017,2098591,0,0 short=0,0,0,0 dropped=0,0,0,0
     latency   : target=0, window=0, percentile=100.00%, depth=32
 
Run status group 0 (all jobs):
   READ: bw=686MiB/s (719MB/s), 686MiB/s-686MiB/s (719MB/s-719MB/s), io=23.0GiB (25.8GB), run=35835-35835msec
  WRITE: bw=229MiB/s (240MB/s), 229MiB/s-229MiB/s (240MB/s-240MB/s), io=8198MiB (8596MB), run=35835-35835msec
 
Disk stats (read/write):
    md4: ios=6256195/2087439, merge=0/0, ticks=0/0, in_queue=0, util=0.00%, aggrios=3144990/2098586, aggrmerge=18/30, aggrticks=475920/253361, aggrin_queue=725774, aggrutil=100.00%
  sdc: ios=1046956/2098567, merge=36/53, ticks=367915/478540, in_queue=802572, util=99.83%
  nvme0n1: ios=5243025/2098606, merge=0/7, ticks=583926/28183, in_queue=648976, util=100.00%
fast-raid10_rand75read: (g=0): rw=randrw, bs=(R) 4096B-4096B, (W) 4096B-4096B, (T) 4096B-4096B, ioengine=libaio, iodepth=32
...
fio-3.13-42-g8066f
Starting 4 processes
 
fast-raid10_rand75read: (groupid=0, jobs=4): err= 0: pid=27399: Mon May 27 18:40:29 2019
  read: IOPS=110k, BW=430MiB/s (451MB/s)(23.0GiB/57145msec)
   bw (  KiB/s): min=414080, max=620144, per=100.00%, avg=441721.99, stdev=7481.88, samples=451
   iops        : min=103520, max=155036, avg=110430.45, stdev=1870.47, samples=451
  write: IOPS=36.7k, BW=143MiB/s (150MB/s)(8198MiB/57145msec); 0 zone resets
   bw (  KiB/s): min=137224, max=206440, per=100.00%, avg=147385.78, stdev=2467.32, samples=451
   iops        : min=34306, max=51610, avg=36846.38, stdev=616.83, samples=451
  cpu          : usr=4.38%, sys=31.09%, ctx=4625955, majf=0, minf=37
  IO depths    : 1=0.1%, 2=0.1%, 4=0.1%, 8=0.1%, 16=0.1%, 32=100.0%, >=64=0.0%
     submit    : 0=0.0%, 4=100.0%, 8=0.0%, 16=0.0%, 32=0.0%, 64=0.0%, >=64=0.0%
     complete  : 0=0.0%, 4=100.0%, 8=0.0%, 16=0.0%, 32=0.1%, 64=0.0%, >=64=0.0%
     issued rwts: total=6290017,2098591,0,0 short=0,0,0,0 dropped=0,0,0,0
     latency   : target=0, window=0, percentile=100.00%, depth=32
 
Run status group 0 (all jobs):
   READ: bw=430MiB/s (451MB/s), 430MiB/s-430MiB/s (451MB/s-451MB/s), io=23.0GiB (25.8GB), run=57145-57145msec
  WRITE: bw=143MiB/s (150MB/s), 143MiB/s-143MiB/s (150MB/s-150MB/s), io=8198MiB (8596MB), run=57145-57145msec
 
Disk stats (read/write):
    md5: ios=6289620/2098512, merge=0/0, ticks=0/0, in_queue=0, util=0.00%, aggrios=3144679/2098476, aggrmerge=329/162, aggrticks=901109/410843, aggrin_queue=980248, aggrutil=100.00%
  nvme0n1: ios=3177529/2098621, merge=0/12, ticks=301788/24926, in_queue=373208, util=100.00%
  sdc: ios=3111830/2098332, merge=658/313, ticks=1500430/796760, in_queue=1587288, util=100.00%
slow-raid1_rand75read: (g=0): rw=randrw, bs=(R) 4096B-4096B, (W) 4096B-4096B, (T) 4096B-4096B, ioengine=libaio, iodepth=32
...
fio-3.13-42-g8066f
Starting 4 processes
 
slow-raid1_rand75read: (groupid=0, jobs=4): err= 0: pid=27428: Mon May 27 19:40:34 2019
  read: IOPS=84, BW=337KiB/s (346kB/s)(1188MiB/3604229msec)
   bw (  KiB/s): min=   28, max= 2486, per=100.00%, avg=540.41, stdev=119.45, samples=17980
   iops        : min=    4, max=  621, avg=134.68, stdev=29.86, samples=17980
  write: IOPS=28, BW=113KiB/s (116kB/s)(398MiB/3604229msec); 0 zone resets
   bw (  KiB/s): min=   28, max= 1087, per=100.00%, avg=215.17, stdev=45.43, samples=15087
   iops        : min=    4, max=  271, avg=53.36, stdev=11.36, samples=15087
  cpu          : usr=0.01%, sys=0.08%, ctx=213113, majf=0, minf=34
  IO depths    : 1=0.1%, 2=0.1%, 4=0.1%, 8=0.1%, 16=0.1%, 32=100.0%, >=64=0.0%
     submit    : 0=0.0%, 4=100.0%, 8=0.0%, 16=0.0%, 32=0.0%, 64=0.0%, >=64=0.0%
     complete  : 0=0.0%, 4=100.0%, 8=0.0%, 16=0.0%, 32=0.1%, 64=0.0%, >=64=0.0%
     issued rwts: total=304053,101763,0,0 short=0,0,0,0 dropped=0,0,0,0
     latency   : target=0, window=0, percentile=100.00%, depth=32
 
Run status group 0 (all jobs):
   READ: bw=337KiB/s (346kB/s), 337KiB/s-337KiB/s (346kB/s-346kB/s), io=1188MiB (1245MB), run=3604229-3604229msec
  WRITE: bw=113KiB/s (116kB/s), 113KiB/s-113KiB/s (116kB/s-116kB/s), io=398MiB (417MB), run=3604229-3604229msec
 
Disk stats (read/write):
    md6: ios=304053/103780, merge=0/0, ticks=0/0, in_queue=0, util=0.00%, aggrios=152025/103790, aggrmerge=1/663, aggrticks=50772659/28311543, aggrin_queue=23973600, aggrutil=53.64%
  sde: ios=143654/103782, merge=2/671, ticks=17259120/5776421, in_queue=12313572, util=23.68%
  sdd: ios=160396/103798, merge=1/655, ticks=84286199/50846665, in_queue=35633628, util=53.64%
slow-raid10_rand75read: (g=0): rw=randrw, bs=(R) 4096B-4096B, (W) 4096B-4096B, (T) 4096B-4096B, ioengine=libaio, iodepth=32
...
fio-3.13-42-g8066f
Starting 4 processes
 
slow-raid10_rand75read: (groupid=0, jobs=4): err= 0: pid=28197: Mon May 27 20:40:45 2019
  read: IOPS=81, BW=328KiB/s (336kB/s)(1156MiB/3610270msec)
   bw (  KiB/s): min=   28, max= 2568, per=100.00%, avg=508.77, stdev=109.01, samples=18593
   iops        : min=    4, max=  642, avg=127.05, stdev=27.25, samples=18593
  write: IOPS=27, BW=110KiB/s (112kB/s)(386MiB/3610270msec); 0 zone resets
   bw (  KiB/s): min=   28, max= 1048, per=100.00%, avg=200.66, stdev=41.08, samples=15746
   iops        : min=    4, max=  262, avg=50.02, stdev=10.27, samples=15746
  cpu          : usr=0.01%, sys=0.07%, ctx=208409, majf=0, minf=37
  IO depths    : 1=0.1%, 2=0.1%, 4=0.1%, 8=0.1%, 16=0.1%, 32=100.0%, >=64=0.0%
     submit    : 0=0.0%, 4=100.0%, 8=0.0%, 16=0.0%, 32=0.0%, 64=0.0%, >=64=0.0%
     complete  : 0=0.0%, 4=100.0%, 8=0.0%, 16=0.0%, 32=0.1%, 64=0.0%, >=64=0.0%
     issued rwts: total=295820,98860,0,0 short=0,0,0,0 dropped=0,0,0,0
     latency   : target=0, window=0, percentile=100.00%, depth=32
 
Run status group 0 (all jobs):
   READ: bw=328KiB/s (336kB/s), 328KiB/s-328KiB/s (336kB/s-336kB/s), io=1156MiB (1212MB), run=3610270-3610270msec
  WRITE: bw=110KiB/s (112kB/s), 110KiB/s-110KiB/s (112kB/s-112kB/s), io=386MiB (405MB), run=3610270-3610270msec
 
Disk stats (read/write):
    md7: ios=295820/100895, merge=0/0, ticks=0/0, in_queue=0, util=0.00%, aggrios=147908/100940, aggrmerge=1/642, aggrticks=51356785/29919840, aggrin_queue=24559964, aggrutil=53.42%
  sde: ios=137873/100905, merge=2/677, ticks=26306419/13385259, in_queue=14197356, util=28.45%
  sdd: ios=157944/100976, merge=1/607, ticks=76407151/46454421, in_queue=34922572, util=53.42%

Measuring Linux IO read/write mix and size

In this article I will show you how to use blktrace (part of the blktrace package on Debian) to measure the characteristics of production IO load.

Why measure IO size and mix? ^

Storage vendors often report the specifications of their devices based on how many 4KiB requests they can read or write, sequentially or randomly. The sequential speed is often quoted in megabytes or gigabytes per second; the random performance as the number of IO operations per second (IOPS). But is this representative of the real world?

IO request size is not the only common assumption. Benchmarks often choose either pure reads or pure writes, and when a mix is suggested a common split is something like 25% writes to 75% reads.

These tests do have value when when the parameters are kept the same, in order to compare setups on a level field. The danger however is that none of the tests will be representative of production workload.

Measuring with blktrace ^

It’s rare that we can just put production load on a test setup. So what can we do? One thing we can do is to use blktrace.

Here is an example of me doing this on some of BitFolk‘s busiest VM hosts. These have MD RAID-10 arrays on pairs of SSDs. I will trace IO on three of these arrays for one hour.

$ sudo blktrace /dev/md4 -w 3600 -o elephant_md4

This will store the (binary format) output into files in the current directory, one per CPU on the host. These can be quite large (in my case about 70MiB per hour) and it is important that you store them somewhere other than the device which you are tracing, otherwise the writes to these will interfere with your trace.

I did the same with elephant_md5 and on another host to produce hobgoblin_md3.

Interpreting the output ^

The binary files that blktrace has produced are just logs of IO requests. There is no analysis there. There are several different tools that can consume blktrace output, but the one that I will use here is called blkparse and is part of the same package.

When blkparse is run simply it will produce a log of IO to standard output and then a summary at the end, like this:

$ blkparse hobgoblin_md3
  9,3    1        1     0.000000000  7548  A  WS 2409885696 + 32 <- (253,63) 20006912
  9,3    1        2     0.000000774  7548  Q  WS 2409885696 + 32 [blkback.8.xvda]
  9,3    1        3     0.000669843  7548  A  WS 2398625368 + 16 <- (253,63) 8746584
  9,3    1        4     0.000670267  7548  Q  WS 2398625368 + 16 [blkback.8.xvda]
  9,3    1        5     0.000985592  7548  A FWS 0 + 0 <- (253,63) 0
[…]
CPU0 (hobgoblin_md3):
 Reads Queued:     578,712,    6,307MiB  Writes Queued:     661,480,    9,098MiB
 Read Dispatches:        0,        0KiB  Write Dispatches:        0,        0KiB
 Reads Requeued:         0               Writes Requeued:         0
 Reads Completed:        0,        0KiB  Writes Completed:        0,        0KiB
 Read Merges:            0,        0KiB  Write Merges:            0,        0KiB
 Read depth:             0               Write depth:             0
 IO unplugs:             0               Timer unplugs:           0
CPU1 (hobgoblin_md3):
 Reads Queued:     663,713,    7,499MiB  Writes Queued:       1,063K,   14,216MiB
 Read Dispatches:        0,        0KiB  Write Dispatches:        0,        0KiB
 Reads Requeued:         0               Writes Requeued:         0
 Reads Completed:        0,        0KiB  Writes Completed:        0,        0KiB
 Read Merges:            0,        0KiB  Write Merges:            0,        0KiB
 Read depth:             0               Write depth:             0
 IO unplugs:             0               Timer unplugs:           0
 
Total (hobgoblin_md3):
 Reads Queued:       1,242K,   13,806MiB         Writes Queued:       1,724K,   23,315MiB
 Read Dispatches:        0,        0KiB  Write Dispatches:        0,        0KiB
 Reads Requeued:         0               Writes Requeued:         0
 Reads Completed:        0,        0KiB  Writes Completed:        0,        0KiB
 Read Merges:            0,        0KiB  Write Merges:            0,        0KiB
 IO unplugs:             0               Timer unplugs:           0

Read/write mix ^

Most of the items in the summary at the end are zero because the MD array is a logical device that doesn’t actually see most of the IO – it gets remapped to a lower layer. In order to see full details you would need to run blktrace against the constituent components of each MD array. It does give enough for the purpose of showing the read/write mix though:

$ for f in elephant_md4 elephant_md5 hobgoblin_md3; do echo $f; blkparse $f | grep Queued: | tail -1; done
elephant_md4
 Reads Queued:     526,458,   18,704MiB  Writes Queued:     116,753,  969,524KiB
elephant_md5
 Reads Queued:     424,788,    5,170MiB  Writes Queued:     483,372,    6,895MiB
hobgoblin_md3
 Reads Queued:       1,242K,   13,806MiB         Writes Queued:       1,724K,   23,315MiB

Simple maths tells us that the read/write mix is therefore approximately:

Array # of reads # of writes Total IOs Read %
elephant_md4 526,458 116,753 643,211 82%
elephant_md5 424,788 483,372 908160 47%
hobgoblin_md3 1,242,000 1,724,000 2,966,000 42%

There is quite a disparity here for one of the arrays on host elephant at 82% reads. I looked into this and it was in fact one customer doing something incredibly read-intensive. Checking a few other arrays on different hosts I found that 20-50% reads is fairly normal. The conclusions I would draw here are:

  1. Checking something around a 40/60 split of read/write is most important for my workload.
  2. Something like the traditional 75/25 split of read/write is still worth examining.

On another note we can take some comfort that elephant is apparently nowhere near its IO limits as the single array on hobgoblin is doing more than both arrays on elephant combined. The extra array was added to elephant purely because it ran out of storage capacity, not because it was hitting IO limits.

IO size ^

What about the size of individual IOs?

For the impatient, here’s some histograms. Click on them for the full size version. See the rest of this section for how they were made.

An excursion into blkparse output ^

If we filter the blkparse output to only show IO of the type we’re interested in then we get something like this (restricting to the first 10ms just for brevity):

$ blkparse hobgoblin_md3 -a write -w 0.01
Input file hobgoblin_md3.blktrace.0 added
Input file hobgoblin_md3.blktrace.1 added
  9,3    1        1     0.000000000  7548  A  WS 2409885696 + 32 <- (253,63) 20006912
  9,3    1        2     0.000000774  7548  Q  WS 2409885696 + 32 [blkback.8.xvda]
  9,3    1        3     0.000669843  7548  A  WS 2398625368 + 16 <- (253,63) 8746584
  9,3    1        4     0.000670267  7548  Q  WS 2398625368 + 16 [blkback.8.xvda]
  9,3    1        5     0.000985592  7548  A FWS 0 + 0 <- (253,63) 0
  9,3    1        6     0.000986169  7548  Q FWS [blkback.8.xvda]
  9,3    1        7     0.001238245  7548  A  WS 2398625384 + 8 <- (253,63) 8746600
  9,3    1        8     0.001238808  7548  Q  WS 2398625384 + 8 [blkback.8.xvda]
  9,3    1        9     0.001502839  7548  A FWS 0 + 0 <- (253,63) 0
  9,3    1       10     0.001503419  7548  Q FWS [blkback.8.xvda]
  9,3    1       11     0.002004499  7548  A  WS 2409903328 + 32 <- (253,63) 20024544
  9,3    1       12     0.002005074  7548  Q  WS 2409903328 + 32 [blkback.8.xvda]
  9,3    1       13     0.002334404  7548  A FWS 0 + 0 <- (253,63) 0
  9,3    1       14     0.002334913  7548  Q FWS [blkback.8.xvda]
CPU1 (hobgoblin_md3):
 Reads Queued:           0,        0KiB  Writes Queued:           7,       44KiB
 Read Dispatches:        0,        0KiB  Write Dispatches:        0,        0KiB
 Reads Requeued:         0               Writes Requeued:         0
 Reads Completed:        0,        0KiB  Writes Completed:        0,        0KiB
 Read Merges:            0,        0KiB  Write Merges:            0,        0KiB
 Read depth:             0               Write depth:             0
 IO unplugs:             0               Timer unplugs:           0
 
Throughput (R/W): 0KiB/s / 0KiB/s
Events (hobgoblin_md3): 14 entries
Skips: 0 forward (0 -   0.0%)

You can look up in the blkparse man page what all this means, but briefly for the first two lines:

9,3
The major and minor number of the block device. Typically 9 means MD and 3 means the third one, hence md3.
1
The CPU number that the IO happened on.
1
The sequence number of the IO.
0.000000000
Time delta (seconds and nanoseconds) into the trace.
7548
The process ID that the IO was on behalf of.

In this case process 7548 on hobgoblin is a Xen disk backend called [blkback.8.xvda]. That means it is the backend for disk xvda on Xen domain ID 8.

A
IO action: remap. An IO came in from or is going out to a stacked device. The details for this action will show what is going where. Or;
Q
IO action: queue. Declaring the intention to queue an IO, but it has not actually happened yet.

And for the details of the actions for the first two lines:

A WS 2409885696 + 32 <- (253,63) 20006912
WS
The "RWBS" data. In this case indicating a Synchronous Write.
2409885696 + 32
The IO starts at sector 2409885696 and is 32 blocks in size. For this device the block size is 512 bytes, so this represents a 16KiB IO.
<- (253,63) 20006912
This IO came from a higher level device with major,minor (253,63) starting at sector 20006912 on that device.

Major number 253 is for LVM logical volumes. The command dmsetup ls will list all logical volumes with their major and minor numbers, so that enables me to tell which LV this IO came from. That information in this case is of course already known since I know from the other details which Xen disk backend process this is associated with.

Q WS 2409885696 + 32 [blkback.8.xvda]
[blkback.8.xvda]
The only different data remaining. It's the name of the process related to this IO.

That covers all output shown except for some IOs which have RWBS data of "F". This does not appear to be documented in the blkparse man page but a look at the blkparse source indicates that this IO is a Force Unit Access. We can surmise that this is a result of the process issuing a synchronous write IO; the FUA is used to ensure that the data has hit stable storage.

If a blktrace had been done on a lower-level device — for example, one of the SSDs that actually makes up these arrays — then there would be a lot of other types of IO and actions present in the blkparse output. What's present is enough though to tell us about the types and sizes of IO that are being queued.

Generating an IO size histogram ^

Here's a quick and dirty Perl script to parse the blkparse output further and generate a textual histogram of IO sizes.

#!/usr/bin/env perl
 
use strict;
use warnings;
 
use Math::Round;
 
my $val;
my %size;
my $total;
 
while(<>) {
    $val = $_;
    chomp($val);
    $size{$val * 512 / 1024}++;
    $total++;
}
 
foreach my $s (sort { $a <=> $b } keys %size) {
    printf "%3d:\t%6u (%2u%%)\n", $s, $size{$s},
        round($size{$s}/$total*100);
}

Which would be run like this:

$ blkparse hobgoblin_md3 -a read | awk '/ Q / { print $10 }' | ./hist.pl
  0:        13 ( 0%)
  4:    874810 (70%)
  8:    151457 (12%)
 12:     15811 ( 1%)
 16:     58101 ( 5%)
 20:      6487 ( 1%)
 24:      9638 ( 1%)
 28:      4619 ( 0%)
 32:     56070 ( 5%)
 36:      3031 ( 0%)
 40:      4036 ( 0%)
 44:      2681 ( 0%)
 48:      3722 ( 0%)
 52:      2311 ( 0%)
 56:      2492 ( 0%)
 60:      2241 ( 0%)
 64:      4999 ( 0%)
 68:      1972 ( 0%)
 72:      2052 ( 0%)
 76:      1331 ( 0%)
 80:      1588 ( 0%)
 84:      1151 ( 0%)
 88:      1389 ( 0%)
 92:      1022 ( 0%)
 96:      1430 ( 0%)
100:      1057 ( 0%)
104:      1457 ( 0%)
108:       991 ( 0%)
112:      1375 ( 0%)
116:       913 ( 0%)
120:      1221 ( 0%)
124:       731 ( 0%)
128:     20226 ( 2%)

Although if you like pretty pictures (who doesn't?) I recommend ditching the Perl script and just dumping the data from blkparse into a CSV file like this:

$ (echo "IO_Size"; blkparse hobgoblin_md3 -a read | awk '/ Q / { if ($10 != 0) { print $10/2 } else print 0 }') > hobgoblin_md3_read_sizes.csv

And then doing a bit of Python/Pandas:

#!/usr/bin/env python
# coding: utf-8
 
# All this is just boilerplate that I do in every Pandas thing.
get_ipython().run_line_magic('matplotlib', 'notebook')
get_ipython().run_line_magic('precision', '3')
 
from IPython.display import set_matplotlib_formats
from pandas.plotting import register_matplotlib_converters
register_matplotlib_converters()
 
import matplotlib
 
import numpy as np
import matplotlib.pyplot as plt
plt.rcParams['figure.figsize'] = [9, 5]
 
import pandas
 
# End boilerplate.
 
# Read in this single column of numbers with a header line at
# the top. So not really a CSV, but reading it as a CSV works.
df=pandas.read_csv("/home/andy/hobgoblin_md3_read_sizes.csv",
                   delim_whitespace=True)
 
total_ios = len(df.index)
min_size = 0
max_size = df["IO_Size"].max()
mode = df["IO_Size"].mode()
mean = df["IO_Size"].mean()
 
# Generate a histogram.
#
# The 'bins' thing uses bins of size 4 offset by 2 either way, so
# the first bin will be -2 to 2, the next one 2 to 6, then 6 to
# 10 and so on. The purpose of that is so that the bar centres on
# the interesting value. For example, 4KiB IO will fall into the
# "2 to 6" bin, the middle of which is 4.
#
# np.arange is necessary because it is possible to get IO in an
# odd number of blocks, e.g. 1 or 3 blocks, which will converted
# to KiB will be non-integer.
ax_list = df.plot(kind='hist',
                  subplots=True,
                  sharex=True,
                  sharey=True,
                  title='hobgoblin md3 read IO sizes',
                  color='g',
                  bins=np.arange(min_size - 2, max_size + 2, 4))
ax_list[0].set_xlim(0, max_size)
ax_list[0].set_xlabel('IO size (KiB)')
ax_list[0].tick_params(axis='x', rotation=-45)
# Major ticks every 4KiB, minor every 2 KiB in between.
ax_list[0].xaxis.set_major_locator(plt.MultipleLocator(4))
ax_list[0].xaxis.set_minor_locator(plt.MultipleLocator(2))
# Convert y tick labels to percentages by multiplying them by
# 100.
y_vals = ax_list[0].get_yticks()
ax_list[0].set_yticklabels(['{:,.1%}'.format(v/total_ios) for v in y_vals])
 
ax_list[0].grid(b=True, linestyle=':', color='#666666')
ax_list[0].legend(["Read IOs"])
 
# x axis label doesn't seem to fit on unless the bottom is
# extended a little.
plt.subplots_adjust(bottom=0.15)
 
# Add an info box with mean/mode values in.
props = dict(boxstyle='round', facecolor='wheat', alpha=0.5)
ax_list[0].text(0.2,
                0.95,
                "Mode: %3uKiB\nMean: %6.2fKiB" % (mode, mean),
                transform=ax_list[0].transAxes,
                fontsize=14,
                verticalalignment='top',
                bbox=props)

Results in the histogram images you saw above.

Conclusions ^

For me, there is quite some variance between arrays as to how they are being used. While 4KiB IO is the most common, the average size is being pulled up to around 14KiB or in some cases near 36KiB. It is probably worth examining 4, 8, 16 and 32KiB IO.

While a 75/25 split of read/write random IO might be worth looking at, for my workload 40/60 is actually more relevant.

Comparing Versions in Ansible Templates

In the last few days, Debian archived their jessie release and removed the jessie-updates suite from the distribution mirrors. Those hosts which still reference jessie-updates and do an apt update will see something like:

W: Failed to fetch http://apt-cacher.lon.bitfolk.com/debian/ftp.uk.debian.org/debian/dists/jessie-updates/main/binary-amd64/Packages  404  Not Found [IP: 2001:ba8:1f1:f079::2 80]

This is because the suite and all of its files were removed from the mirrors. The files have now been archived and will be picked up by just using the jessie suite on archive.debian.org, so no longer any need to reference jessie-updates.

In order to not see that every time you should remove the jessie-updates line from /etc/apt/sources.list.

My /etc/apt/sources.list is built by Ansible from a template, and the relevant part of the template looked a bit like this:

{% if ansible_distribution_version >= 8.0 %}
deb {{ aptcacher_prefix }}{{ debian_mirror }} {{ ansible_distribution_release }}-updates   main contrib non-free
{% endif %}

ansible_distribution_version and ansible_distribution_release are host variables, and for Debian jessie currently evaluate as the strings “8.11” and “jessie” respectively.

As there is now only an -updates for Debian stable (version 9.x, “stretch”) the “if” statement should be testing against “9.0”, right? So I changed it to:

{% if ansible_distribution_version >= 9.0 %}
deb {{ aptcacher_prefix }}{{ debian_mirror }} {{ ansible_distribution_release }}-updates   main contrib non-free
{% endif %}

Well, that made no difference. jessie-updates was still being included.

The reason why this didn’t work is that the string “8.11” is being compared against “9.0” and “8.11” is actually bigger! This is a very common mistake. In order to fix it the values could be cast, but a better idea is the use the version test (previously known as version_comparison):

{% if ansible_distribution_version is version('9.0', '>=') %}
deb {{ aptcacher_prefix }}{{ debian_mirror }} {{ ansible_distribution_release }}-updates   main contrib non-free
{% endif %}

Looking through all of my playbooks it seems that I’d figured this out long ago for the playbooks themselves — every test of ansible_distribution_version in YAML files was using version() — but some of my templates were still directly trying to use “>” or “>=”.

Of course, since jessie has now been archived it is only receiving security support from the Debian LTS effort and hosts running jessie should be upgraded as soon as possible.

Forcing the source address of an SNMP client (e.g. snmpwalk)

I was using snmpwalk earlier and it kept using the “wrong” IP address to send packets from. The destination was firewalled to only accept packets from certain sources, and I didn’t want to poke another hole just because snmpwalk was being stupid.

I read a lot of man pages to try to find out how to specify the source address but couldn’t find anything anywhere. Eventually I uncovered a post from 2004 saying that you can use the clientaddr directive in snmp.conf.

So, just so this is easy to find the next time I need it, you can force it on the command line with:

$ snmpwalk --clientaddr=192.168.0.1 …

And you do have to put the ‘=’ in there.

Ansible, ARA and MariaDB (or MySQL)

ARA ^

A short while back I switched to Ansible for configuration management.

One of the first things I needed was a way to monitor Ansible runs for problems, you know, so I wasn’t relying on seeing abnormal logging to tell me that a particular host was unreachable, or that tasks were failing somewhere.

I know I could use Ansible Tower for this, but it seemed like such a heavyweight solution for what seems like a simple requirement. That was when I found ARA.

Honestly even ARA is more than I need, and I don’t typically find myself using the web interface even though it’s very pretty. No, I’m only really interested in poking around in the database.

It’s great that it’s simple to install and get started with, so very quickly I was recording details about my Ansible runs a SQLite database, which is the default setup. From there it was a simple SQL query to check if a particular host had suffered any task failures. It was easy to knock up a Nagios-compatible check plugin to call from my Icinga2 monitoring.

Issues ^

Excess data ^

The first problem I noted was that the SQLite database file was starting to grow in size quite rapidly. Around one week of run data used around 800MiB of storage. It’s not huge, but it was relentlessly growing and I could see very little value in keeping that data as I never looked at data from runs more than a few days previous. So, I wrote a script to delete old stuff from the database, keeping the last week’s worth.

Locking ^

Next up I started seeing SQLite locking problems.

Checks from Icinga2 were connecting to the SQLite DB, and so was the prune script, and Ansible itself too. The ARA Ansible plugin started complaining about locking:

[WARNING]: Failure using method (v2_runner_on_ok) in callback plugin                                                   
(<ansible.plugins.callback./opt/ansible/venv/ansible/lib/python2.7/site-                                                  
packages/ara/plugins/callbacks/log_ara.CallbackModule object at                                                         
0x7f2a84834b10>): (sqlite3.OperationalError) database is locked [SQL: u'SELECT                                          
tasks.id AS tasks_id, tasks.playbook_id AS tasks_playbook_id, tasks.play_id AS                                          
tasks_play_id, tasks.name AS tasks_name, tasks.sortkey AS tasks_sortkey,                                                
tasks.action AS tasks_action, tasks.tags AS tasks_tags, tasks.is_handler AS                                             
tasks_is_handler, tasks.file_id AS tasks_file_id, tasks.lineno AS tasks_lineno,                                         
tasks.time_start AS tasks_time_start, tasks.time_end AS tasks_time_end \nFROM                                           
tasks \nWHERE tasks.id = ?'] [parameters:                                                                               
('5f4506f7-95ac-4468-bea3-672d399d4507',)] (Background on this error at:                                                
http://sqlalche.me/e/e3q8)

The Ansible playbook run itself isn’t quick, taking about 13 minutes at the moment, and it seems like sometimes when that was running the check script too was running into locking issues resulting in alerts that were not actionable.

The ARA Ansible reporting plugin is the only thing that should be writing to the database so I thought it should be simple to let that have a write lock while everything else is freely able to read, but I couldn’t get to the bottom of this. No matter what I tried I was getting lock errors not just from ARA but also from my check script.

The basic problem here is that SQLite really isn’t designed for multiple concurrent access. I needed to move to a proper database engine.

At this point I think people really should be looking at PostgreSQL. My postgres knowledge is really rusty though, and although MySQL has its serious issues I felt like I had a handle on them. Rather than have this be the only postgres thing I have deployed I decided I’d do it with MariaDB.

MariaDB ^

So, MariaDB. Debian stretch. That comes with v10.1. Regular install, create the ARA database, point Ansible at it, do a playbook run and let ARA create its tables on first run. Oh.

UTF8 what? ^

Every play being run by Ansible was giving this warning:

PLAY [all] **************************************************************************
/opt/ansible/venv/ansible/local/lib/python2.7/site-packages/pymysql/cursors.py:170: Warning: (1300, u"Invalid utf8 character string: '9C9D56'")                             
  result = self._query(query)

A bit of searching around suggested that my problem here was that the database was defaulting to utf8mb3 character set when these days MariaDB (and MySQL) should really be using utf8mb4.

Easy enough, right? Just switch to utf8mb4. Oh.

[WARNING]: Skipping plugin (/opt/ansible/venv/ansible/lib/python2.7/site-             
packages/ara/plugins/callbacks/log_ara.py) as it seems to be invalid:                
(pymysql.err.InternalError) (1071, u'Specified key was too long; max key length is
767 bytes') [SQL: u'\nCREATE TABLE files (\n\tid VARCHAR(36) NOT NULL,
\n\tplaybook_id VARCHAR(36), \n\tpath VARCHAR(255), \n\tcontent_id VARCHAR(40),
\n\tis_playbook BOOL, \n\tPRIMARY KEY (id), \n\tFOREIGN KEY(content_id) REFERENCES
file_contents (id), \n\tFOREIGN KEY(playbook_id) REFERENCES playbooks (id) ON DELETE
RESTRICT, \n\tUNIQUE (playbook_id, path), \n\tCHECK (is_playbook IN (0, 1))\n)\n\n']
(Background on this error at: http://sqlalche.me/e/2j85)

The problem now is that by default InnoDB has a maximum key length of 767 bytes, and with the utf8mb4 character set it is possible for each character to use up 4 bytes. A VARCHAR(255) column might need 1020 bytes.

Bigger keys in InnoDB ^

It is possible to increase the maximum key size in InnoDB to 3,000 and something bytes. Here’s the configuration options needed:

[mysqld]
innodb_file_format=Barracuda
innodb_large_prefix=1

But sadly in MariaDB 10.1 even that is not enough, because the InnoDB row format in v10.1 is compact. In order to use large prefixes you need to use either compressed or dynamic.

In MariaDB v10.2 the default changes to dynamic and there is an option to change the default on a server-wide basis, but in v10.1 as packaged with the current Debian stable the only way to change the row format is to override it on the CREATE TABLE command.

Mangling CREATE TABLE ^

Well, this is a little awkward. ARA creates its own database schema when you run it for the first time. Or, you can tell it not to do that, but then you need to create the database schema yourself.

I could have extracted the schema out of the files in site-packages/ara/db/versions/ (there’s only two files), but for a quick hack it was easier to change them. Each op.create_table( needs to have a line added right at the end, e.g. changing from this:

def upgrade():
    op.create_table('data',
    sa.Column('id', sa.String(length=36), nullable=False),                       
    sa.Column('playbook_id', sa.String(length=36), nullable=True),
    sa.Column('key', sa.String(length=255), nullable=True),
    sa.Column('value', models.CompressedData((2 ** 32) - 1), nullable=True),
    sa.ForeignKeyConstraint(['playbook_id'], ['playbooks.id'], ondelete='RESTRICT'),
    sa.PrimaryKeyConstraint('id'),
    sa.UniqueConstraint('playbook_id', 'key')
    )
    ### end Alembic commands ###

To this:

def upgrade():
    op.create_table('data',
    sa.Column('id', sa.String(length=36), nullable=False),                       
    sa.Column('playbook_id', sa.String(length=36), nullable=True),
    sa.Column('key', sa.String(length=255), nullable=True),
    sa.Column('value', models.CompressedData((2 ** 32) - 1), nullable=True),
    sa.ForeignKeyConstraint(['playbook_id'], ['playbooks.id'], ondelete='RESTRICT'),
    sa.PrimaryKeyConstraint('id'),
    sa.UniqueConstraint('playbook_id', 'key'),
    mysql_row_format='DYNAMIC'
    )
    ### end Alembic commands ###

That’s not a good general purpose patch because this is specific to MariaDB/MySQL whereas ARA supports SQLite, MySQL and PostgreSQL. I’m not familiar enough with sqlalchemy/alembic to know how it should properly be done. Maybe the ARA project would take the view that it shouldn’t be done, since the default row format changed already in upstream InnoDB. But I need this to work now, with a packaged version of MariaDB.

Wrapping up ^

So there we go, that all works now, no concurrency issues, ARA is able to create its schema and insert its data properly and my scripts were trivial to port from SQLite syntax to MariDB syntax. The database still needs pruning, but that was always going to be the case.

It was a little more work than I really wanted, having to run a full database engine just to achieve the simple task of monitoring runs for failures, but I think it’s still less work than installing Ansible Tower.

It is a shame that ARA doesn’t work with a Debian stable package of MariaDB or MySQL just by following ARA’s install instructions. I have a feeling this should be considered a bug in ARA but I’m not sure enough to just go ahead and file it, and it seems that the only discussion forums are IRC and Slack. Anyway, once the newer versions of MariaDB and MySQL find their way into stable releases hopefully the character set issues will be a thing of the past.

This limited key length thing (and the whole of MySQL’s history with UTF8 in general) is just another annoyance in a very very long list of MySQL annoyances though, most of them stemming from basic design problems. That’s why I will reiterate: if you’re in a position to do so, I recommend picking PostgreSQL over MySQL.

Another disappointing btrfs experience

I’ve been using btrfs on my home fileserver for about 4½ years. I am not entirely happy with it and kind of wish I never did it; I will certainly not be introducing it anywhere else. I’m also pretty lazy though, which probably explains why I haven’t ripped it out and replaced it with something else yet.

I’ve had a few problems with it over the years. To be fair I’ve never lost any data; it’s really the availability aspects of it which I feel just aren’t ready yet. When I use multiple storage devices it’s generally to increase availability. I don’t expect device failure to stop me doing what I need to do, at least for small amounts of device failure.

Unfortunately btrfs has consistently not lived up to these expectations. Almost every single-disk failure I’ve had in the past has resulted in an “outage” of some sort. As this is just our data, at home, it may be strange to think of it as an outage, but that’s what it is. Our data became unavailable in some way for some period of time.

This time around, one of the drives started throwing up “Currently unreadable (pending)” and “Offline uncorrectable” sectors a few days ago. That means that there’s areas of the drive that it cannot read. Initially there were just a small number, and a scrub came back clean so that suggested the problem sectors were at that time outside of any filesystem.

In a more critical setting I’d have spare drives available and would just swap them, but for home use I’m usually comfortable with forcing the drive to reallocate these by forcing a write, before ordering a replacement if the problem doesn’t go away. Worst case, I have backups.

After a day or so though, the number of problem sectors was increasing and it was obvious the drive was going to die fairly soon. I ordered a replacement. About 6 hours before the replacement arrived the drive completely stopped responding.

Now, this drive was at the time one of five in the btrfs filesystem, and the filesystem has a raid1 storage policy so there should have been no issue with one device going missing. But apparently there was a problem. btrfs sits spewing the kernel log with errors about lost writes to a device that’s no longer there; the filesystem goes read-only.

The replacement drive arrives, but with the filesystem read-only I can’t add it. I can’t even unmount the filesystem (says it is busy but lsof doesn’t see any users). Nope, I had to reboot the fileserver, at which point the filesystem wouldn’t mount at all because you have to give it the degraded mount option if you want it to mount with any devices missing.

Add the replacement drive, btrfs device remove missing /path/to/fs to kick off a remove of the dead device. Things are at least up and running read-write while this is going on. In fact it’s still going on, because there was 1.2TiB of data on the dead device and reconstructing it is painfully slow. As I write this we’re now about 9 hours in and there’s still about 421GiB to go.

So, it’s not terrible. No data was lost (probably). A short outage due to a required reboot. But it is kind of disappointing and not really how I want to be spending my time just because a single HDD slipped its mortal coil. I am massively thankful that the operating system of that fileserver is still on four other HDDs on ext4+lvm+md and never give me any trouble. Otherwise I’d have to be booting into a rescue OS to fix this sort of thing. When the thing you’re glad of is that you didn’t use a filesystem, that isn’t a great advert for that filesystem.

I should probably try to find some time to play (again) with ZFS-on-Linux. I did actually give it a go last year but got bogged down trying to compare its performance against btrfs and ext4+lvm+md using fio, which proved quite difficult to do, and I moved on to other things.

One of the things that initially attracted me to btrfs is the possibility of using a mish-mash of differently-sized drives. Due to BitFolk constantly replacing hardware I have in my possession plenty of HDDs of differing sizes that are individually perfectly serviceable, but would be awkward to try to match up into identical sizes for conventional RAID arrays. Over the years of this btrfs filesystem it had started out with mostly 250G drives and just before this failure it was 1x 1TB, 3x 2TB and 1x 3TB.

I had thought that ZFS requires every device to be the same capacity (i.e. it would only use the smallest capacity) but I’ve since been informed that ZFS will just use the capacity of the smallest device in the vdev. So assuming mirror vdevs, I’d just need to pair the drives up (or accept that the capacity will be that of the smaller of the two).

That doesn’t seem too onerous at all, when considering the advantages that ZFS would bring. I’m most interested in the self-healing (checksums) and the storage tiering (through using faster devices like SSDs for L2ARC and ZIL). btrfs doesn’t have a good solution for tiering yet, unless you are insane and want to play with bcache(fs).

So, yeah, should stop being lazy and crack on with ZFS again. In my copious free time.