I don’t think the cheapest APC Back-UPS units can be monitored except in Windows

TL;DR: Despite otherwise seeming to work correctly, I can’t monitor a Back-UPS BX1600MI in Linux without seeing a constant stream of spurious battery detach/reattach and power fail/restore events that last less than 2 seconds each. I’ve tried multiple computers and multiple UPSes of that model. It doesn’t happen in their own proprietary Windows software, so I think they’ve changed the protocol.

Apart from nearly two decades ago when I was given one for free, I’ve never bothered with a UPS at home. Our power grid is very reliable. Looking at availability information from “uptimed“, my home file server has been powered on for 99.97% of the time in the last 14 years. That includes time spent moving house and a day when the house power was off for several hours while the kitchen was refitted!

However, in December 2023 a fault with our electric oven popped the breaker for the sockets causing everything to be harshly powered off. My fileserver took it badly and one drive died. That wasn’t a huge issue as it has a redundant filesystem, but I didn’t like it.

I decided I could afford to treat myself to a relatively cheap UPS.

I did some research and read some reviews of the APC Back-UPS range, their cheapest offering. Many people were dismissive calling them cheap pieces of crap with flimsy plastic construction and batteries that are not regarded as user-replaceable. But there was no indication that such a model would not work, and I felt it hard to justify paying a lot here.

I found YouTube videos of the procedure that a technician would go through to replace the battery in 3 to 5 years. To do it yourself voids your warranty, but your warranty is done after 3 years anyway. It looked pretty doable even for a hardware-avoidant person like myself.

It’s important to me that the UPS can be monitored by a Linux computer. The entire point here is that the computer detects when the battery is near to exhausted and gracefully powers itself down. There are two main options on Linux for this: apcupsd and Network UPS Tools (“nut“).

Looking at the Back-UPS BX1600MI model, it has a USB port for monitoring and says it can be monitored with APC’s own Powerchute Serial Shutdown Windows software. There’s an entry in nut‘s hardware compatibility list for “Back-UPS (USB)” of “supported, based on publicly available protocol”. I made the order.

The UPS worked as expected in terms of being an uninterruptible power supply. It was hopeless trying to talk to it with nut though. nut just kept saying it was losing communications.

I tried apcupsd instead. This stayed connected, but it showed a continuous stream of battery detach/reattach and power fail/restore events each lasting less than 2 seconds. Normally on a power fail you’d expect a visual and audible alert on the UPS itself and I wasn’t getting any of that, but I don’t know if that’s because they were real events that were just too brief.

I contacted APC support but they were very quick to tell me that they did not support any other software but their own Windows-only Powerchute Serial Shutdown (PCSS).

I then asked about this on the apcupsd mailing list. The first response:

“Something’s wrong with your UPS, most likely the battery is bad, but since you say the UPS is brand new, just get it replaced.”

As this thing was brand new I wasn’t going to go through a warranty claim with APC. I just contacted the vendor and told them I thought it was faulty and I wanted to return it. They actually offered to send me another one in advance and me send back the one I had, so I went for that.

In the mean time I found time to install Windows 10 in a virtual machine and pass through USB to it. Guess what? No spurious events in PCSS on Windows. It detected expected events when I yanked the power etc. I had no evidence that the UPS was in any way faulty. You can probably see what is coming.

The replacement UPS (of the same model) behaved exactly the same: spurious events. This just seems to be what the APC Back-UPS does on non-Windows.

Returning to my thread on the apcupsd mailing list, I asked again if there was actually anyone out there who had one of these working with non-Windows. The only substantive response I’ve got so far is:

“BX are the El Cheapo plastic craps, worst of all, not even the BExx0 family is such a crap – Schneider’s direct response to all the chinese craps flooding the markets […] no sane person would buy these things, but, well, here we are.”

So as far as I am aware, the Back-UPS models cannot currently be monitored from non-Windows. That will have to be my working theory unless someone who has it working with non-Windows contacts me to let me know I am wrong, which I would be interested to know about. I feel like I’ve done all that I can to find such people, by asking on the mailing list for the software that is meant for monitoring APC UPSes on Unix.

After talking all this over with the vendor they’ve recommended a Riello NPW 1.5kVA which is listed as fully supported by nut. They are taking the APC units back for a full refund; the Riello is about £30 more expensive.

Farewell Soekris, old friend

This morning I shut off the Soekris Engineering net4801 that has served as our home firewall / PPP termination box for just over 18½ years.

Front view of a Soekris net4801
Front view of a Soekris net4801. Clothes peg for scale.
Inside of a Soekris net4801
Inside of a Soekris net4801.

In truth this has been long overdue. Like, at least 10 years overdue. It has been struggling to cope with even our paltry ~60Mbps VDSL (what UK calls Fibre to the Cabinet). But I am very lazy, and change is work.

In theory we can get fibre from Openreach to approach 1Gbit/s down, and I should sort that out, but see above about me being really very lazy. The poor old Soekris would certainly not be viable then.

I’ve replaced it with a PC Engines APU2 (the apu2e2 model). Much like the Soekris it’s a fanless single board x86 computer with coreboot firmware so it’s manageable from the BIOS over serial.

Soekris net4801 PC Engines apu2e2
CPU AMD GX1
1 core @266MHz
x86 (32-bit)
AMD GX-412TC
4 cores @1GHz (turbo 1.4GHz)
amd64 (64-bit)
Memory 128MiB 2048MiB
Storage 512MiB CompactFlash 16GiB mSATA SSD
Ports 3x 100M Ethernet, 1 serial 3x 1G Ethernet, 1 serial

The Soekris ran Debian and so does the APU2. Installing it over PXE was completely straightforward on the APU2; a bit simpler than it was with the net4801 back in 2005! If you have just one and it’s right there in the same building then it’s probably quicker to just boot the Debian installer off of USB though. I may be lazy but once I do get going I’m also pointlessly bloody-minded.

Anyway, completely stock Debian works fine, though obviously it has no display whatsoever — all non-Ethernet-based interaction would have to be done over serial. By default that runs at 115200 baud (8n1).

This is not “home server” material. Like the Soekris even in 2005 it’s weak and it’s expensive for what it is. It’s meant to be an appliance. I think I was right with the Soekris’s endurance, beyond even sensible limits, and I hope I will be right about the APU2.

The Soekris is still using its original 512M CompactFlash card from 2005 by the way. Although admittedly I did go to some effort to make it run on a read-only filesystem, only flipped to read-write for upgrades.

Intel may need me to sign an NDA before I can know the capacity of one of their SSDs

Apologies for the slightly clickbaity title! I could not resist. While an Intel employee did tell me this, they are obviously wrong.

Still, I found out some interesting things that I was previously unaware of.

I was thinking of purchasing some “3.84TB” Intel D3-S4610 SSDs for work. I already have some “3.84TB” Samsung SM883s so it would be good if the actual byte capacity of the Intel SSDs were at least as much as the Samsung ones, so that they could be used to replace a failed Samsung SSD.

To those with little tech experience you would think that two things which are described as X TB in capacity would be:

  1. Actually X TB in size, where 1TB = 1,000 x 1,000 x 1,000 x 1,000 bytes, using powers of ten SI prefixes. Or;
  2. Actually X TiB in size, where 1TiB = 1,024 x 1,024 x 1,024 x 1,024 bytes, using binary prefixes.

…and there was a period of time where this was mostly correct, in that manufacturers would prefer something like the former case, as it results in larger headline numbers.

The thing is, years ago, manufacturers used to pick a capacity that was at least what was advertised (in powers of 10 figures) but it wasn’t standardised.

If you used those drives in a RAID array then it was possible that a replacement—even from the same manufacturer—could be very slightly smaller. That would give you a bad day as you generally need devices that are all the same size. Larger is okay (you’ll waste some), but smaller won’t work.

So for those of us who like me are old, this is something we’re accustomed to checking, and I still thought it was the case. I wanted to find out the exact byte capacity of this Intel SSD. So I tried to ask Intel, in a live support chat.

Edgar (22/02/2021, 13:50:59): Hello. My name is Edgar and I’ll be helping you today.

Me (22/02/2021, 13:51:36): Hi Edgar, I have a simple request. Please could you tell me the exact byte capacity of a SSD-SSDSC2KG038T801 that is a 3.84TB Intel D3-S4610 SSD

Me (22/02/2021, 13:51:47): I need this information for matching capacities in a RAID set

Edgar (22/02/2021, 13:52:07): Hello, thank you for contacting Intel Technical Support. It is going to be my pleasure to help you.

Edgar (22/02/2021, 13:53:05): Allow me a moment to create a ticket for you.

Edgar (22/02/2021, 13:57:26): We have a calculation to get the decimal drive sectors of an SSD because the information you are asking for most probably is going to need a Non-Disclousre Agreement (NDA)

Yeah, an Intel employee told me that I might need to sign an NDA to know the usable capacity of an SSD. This is obviously nonsense. I don’t know whether they misunderstood and thought I was asking about the raw capacity of the flash chips or what.

Me (22/02/2021, 13:58:15): That seems a bit strange. If I buy this drive I can just plug it in and see the capacity in bytes. But if it’s too small then that is a wasted purchase which would be RMA’d

Edgar (22/02/2021, 14:02:48): It is 7,500,000,000

Edgar (22/02/2021, 14:03:17): Because you take the size of the SSD that is 3.84 in TB, in Byte is 3840000000000

Edgar (22/02/2021, 14:03:47): So we divide 3840000000000 / 512 which is the sector size for a total of 7,500,000,000 Bytes

Me (22/02/2021, 14:05:50): you must mean 7,500,000,000 sectors of 512byte, right?

Edgar (22/02/2021, 14:07:45): That is the total sector size, 512 byte

Edgar (22/02/2021, 14:08:12): So the total sector size of the SSD is 7,500,000,000

Me (22/02/2021, 14:08:26): 7,500,000,000 sectors is only 3,750GB so this seems rather unlikely

The reason why this seemed unlikely to me is that I have never seen an Intel or Samsung SSD that was advertised as X.Y TB capacity that did not have a usable capacity of at least X,Y00,000,000,000 bytes. So I would expect a “3.84TB” device to have at least 3,840,000,000,000 bytes of usable capacity.

Edgar was unable to help me further so the support chat was ended. I decided to ask around online to see if anyone actually had one of these devices running and could tell me the capacity.

Peter Corlett responded to me with:

As per IDEMA LBA1-03, the capacity is 1,000,194,048 bytes per marketing gigabyte plus 10,838,016 bytes. A marketing terabyte is 1000 marketing gigabytes.

3840 * 1000194048 + 10838016 = 3840755982336. Presumably your Samsung disk has that capacity, as should that Intel one you’re eyeing up.

My Samsung ones do! And every other SSD I’ve checked obeys this formula, which explains why things have seemed a lot more standard recently. I think this might have been standardised some time around 2014 / 2015. I can’t tell right now because the IDEMA web site is down!

So the interesting and previously unknown to me thing is that storage device sizes are indeed standardised now, albeit not to any sane definition of the units that they use.

What a relief.

Also that Intel live support sadly can’t be relied upon to know basic facts about Intel products. 🙁

Linux RAID-10 fixed on imbalanced devices?

Recap ^

In a previous article I demonstrated that Linux RAID-10 lacked an optimisation for non-rotational devices that was present in RAID-1.

In the case of imbalanced devices such as my system with one SATA SSD and one PCI NVMe, this could cause RAID-10 to perform 3 times worse than RAID-1 at random reads.

A possible fix ^

Kernel developer Guoqing Jiang contacted me to provide a patch to add the same optimisation that is present in RAID-1 to RAID-10.

Updated performance figures ^

I’ve applied Guoqing’s patch and re-run the tests for the RAID-10 targets. Figures for other targets are from the pervious post for comparison.

Sequential IO ^

Test Throughput (MiB/s)
Fast RAID-1 Fast RAID-10 Fast RAID-10 (patched) Slow RAID-1 Slow RAID-10 Slow RAID-10 (patched)
Read 1,237 1,682 2,141 198 188 211
Write 321 321 321 18 19 19

The patched RAID-10 is the clear winner for sequential IO. It even peforms about 27% faster than the unpacthed variant.

Random IO ^

Test IOPS
Fast RAID-1 Fast RAID-10 Fast RAID-10 (patched) Slow RAID-1 Slow RAID-10 Slow RAID-10 (patched)
Random Read 602,000 208,000 602,000 501 501 487
Random Write 82,200 82,200 82,200 25 21 71

The patched RAID-10 is now indistinguishable from performance of RAID-1, almost 3 times faster than without the patch!

I am unable to explain why RAID-10 writes on the slow devices (HDDs) is so much better than before.

The patch ^

Guoqing Jiang’s patch is as follows in case anyone wants to test it. Guoqing has only compile-tested it as they don’t have the required hardware. I have tested it and it seems okay, but don’t use it on any data you care about yet.

diff --git a/drivers/md/raid10.c b/drivers/md/raid10.c
index 25e97de36717..2ebe49b18aeb 100644
--- a/drivers/md/raid10.c
+++ b/drivers/md/raid10.c
@@ -745,15 +745,19 @@ static struct md_rdev *read_balance(struct r10conf *conf,
        int sectors = r10_bio->sectors;
        int best_good_sectors;
        sector_t new_distance, best_dist;
-       struct md_rdev *best_rdev, *rdev = NULL;
+       struct md_rdev *best_dist_rdev, *best_pending_rdev, *rdev = NULL;
        int do_balance;
-       int best_slot;
+       int best_dist_slot, best_pending_slot;
+       int has_nonrot_disk = 0;
+       unsigned int min_pending;
        struct geom *geo = &conf->geo;
 
        raid10_find_phys(conf, r10_bio);
        rcu_read_lock();
-       best_slot = -1;
-       best_rdev = NULL;
+       best_dist_slot = -1;
+       min_pending = UINT_MAX;
+       best_dist_rdev = NULL;
+       best_pending_rdev = NULL;
        best_dist = MaxSector;
        best_good_sectors = 0;
        do_balance = 1;
@@ -775,6 +779,8 @@ static struct md_rdev *read_balance(struct r10conf *conf,
                sector_t first_bad;
                int bad_sectors;
                sector_t dev_sector;
+               unsigned int pending;
+               bool nonrot;
 
                if (r10_bio->devs[slot].bio == IO_BLOCKED)
                        continue;
@@ -811,8 +817,8 @@ static struct md_rdev *read_balance(struct r10conf *conf,
                                        first_bad - dev_sector;
                                if (good_sectors > best_good_sectors) {
                                        best_good_sectors = good_sectors;
-                                       best_slot = slot;
-                                       best_rdev = rdev;
+                                       best_dist_slot = slot;
+                                       best_dist_rdev = rdev;
                                }
                                if (!do_balance)
                                        /* Must read from here */
@@ -825,14 +831,23 @@ static struct md_rdev *read_balance(struct r10conf *conf,
                if (!do_balance)
                        break;
 
-               if (best_slot >= 0)
+               nonrot = blk_queue_nonrot(bdev_get_queue(rdev->bdev));
+               has_nonrot_disk |= nonrot;
+               pending = atomic_read(&rdev->nr_pending);
+               if (min_pending > pending && nonrot) {
+                       min_pending = pending;
+                       best_pending_slot = slot;
+                       best_pending_rdev = rdev;
+               }
+
+               if (best_dist_slot >= 0)
                        /* At least 2 disks to choose from so failfast is OK */
                        set_bit(R10BIO_FailFast, &r10_bio->state);
                /* This optimisation is debatable, and completely destroys
                 * sequential read speed for 'far copies' arrays.  So only
                 * keep it for 'near' arrays, and review those later.
                 */
-               if (geo->near_copies > 1 && !atomic_read(&rdev->nr_pending))
+               if (geo->near_copies > 1 && !pending)
                        new_distance = 0;
 
                /* for far > 1 always use the lowest address */
@@ -841,15 +856,21 @@ static struct md_rdev *read_balance(struct r10conf *conf,
                else
                        new_distance = abs(r10_bio->devs[slot].addr -
                                           conf->mirrors[disk].head_position);
+
                if (new_distance < best_dist) {
                        best_dist = new_distance;
-                       best_slot = slot;
-                       best_rdev = rdev;
+                       best_dist_slot = slot;
+                       best_dist_rdev = rdev;
                }
        }
        if (slot >= conf->copies) {
-               slot = best_slot;
-               rdev = best_rdev;
+               if (has_nonrot_disk) {
+                       slot = best_pending_slot;
+                       rdev = best_pending_rdev;
+               } else {
+                       slot = best_dist_slot;
+                       rdev = best_dist_rdev;
+               }
        }
 
        if (slot >= 0) {

Exploring different Linux RAID-10 layouts with unbalanced devices

Background ^

In a previous article I explored the performance of different Linux RAID configurations in a situation where there are two very mismatched devices.

The two devices are a Samsung SM883 SATA SSD and a Samsung PM983 NVMe. Both of these devices are very fast, but the NVMe can be 6 times faster than the SSD for random (4KiB) reads.

The previous article established that due to performance optimisations in Linux RAID-1 targeted at non-rotational devices like SSDs, RAID-1 outperforms RAID-10 by about 3x for random reads in this unbalanced setup.

RAID-10 Layouts ^

A respondent on the linux-raid list suggested I test out different RAID-10 layouts. The default RAID-10 layout on Linux corresponds to the standard and is called near. There are also two alternative layouts, far and offset. Wikipedia has a good article on the difference between these three layouts.

Charts ^

Click on the thumbnails to see full size images.

Sequential IO ^

Reads ^


far and offset layouts perform the same: about twice the speed of a single SSD, but only ~57% of RAID-1 and interestingly only ~77% of RAID-10 near layout.

Writes ^


All layouts perform the same for sequential writes (the same as RAID-1).

Random IO ^

Reads ^


far and offset performed slightly worse than near (~94%) and still only about a third of RAID-1.

Writes ^


All layouts of RAID-10 perform the same as RAID-1 for random writes.

Data Tables ^

This is just the raw data for the charts above. Skip to the conclusions if you’re not interested in seeing the numbers for the things you already saw as pictures.

Sequential IO ^

Test Throughput (MiB/s)
SSD NVMe HDD Fast RAID-1 Fast RAID-10 (near) Fast RAID-10 (far) Fast RAID-10 (offset) Slow RAID-1 Slow RAID-10 (near)
Read 489 2,227 26 1,237 1,682 954 954 198 188
Write 447 1,754 20 321 321 321 322 18 19

Random IO ^

Test IOPS
SSD NVMe HDD Fast RAID-1 Fast RAID-10 (near) Fast RAID-10 (far) Fast RAID-10 (offset) Slow RAID-1 Slow RAID-10 (near)
Random Read 98,200 605,000 256 602,000 208,000 196,000 196,000 501 501
Random Write 86,100 435,000 74 82,200 82,200 82,300 82,300 25 21

Conclusions ^

I was not able to see any difference between the non-default Linux RAID-10 layouts for my devices and I think it’s likely this holds for all non-rotational devices in general.

far and offset layouts performed significantly worse than the default near layout for sequential read IO and no better than the default near layout in any other scenario.

Since layouts other than the default near restrict the reshaping options for RAID-10, I don’t recommend using them for RAID-10 composed entirely of non-rotational devices.

Additionally, if — as in my case — the devices have a big variance in performance compared to each other then it remains best to use RAID-1.

Appendix ^

Setup ^

I’ll only cover what has changed from the previous article.

Partitioning ^

I added two extra 10GiB partitions on each device; one for testing the far layout and the other for testing the offset layout.

$ sudo gdisk /dev/sdc                                                        
GPT fdisk (gdisk) version 1.0.3                                                                                                                                           
Partition table scan:                                                                
  MBR: protective                                                                   
  BSD: not present                                                                   
  APM: not present                                                                   
  GPT: present                                                                      
 
Found valid GPT with protective MBR; using GPT.                                     
 
Command (? for help): p                                                        
Disk /dev/sdc: 7501476528 sectors, 3.5 TiB                                           Model: SAMSUNG MZ7KH3T8                                            
Sector size (logical/physical): 512/4096 bytes                   
Disk identifier (GUID): 7D7DFDA2-502C-47FE-A437-5442CCCE7E6B
Partition table holds up to 128 entries                                              Main partition table begins at sector 2 and ends at sector 33                        
First usable sector is 34, last usable sector is 7501476494                         
Partitions will be aligned on 2048-sector boundaries                                
Total free space is 7438561901 sectors (3.5 TiB)                                                                                                                          
Number  Start (sector)    End (sector)  Size       Code  Name                        
   1            2048        20973567   10.0 GiB    8300  Linux filesystem          
   2        20973568        41945087   10.0 GiB    8300  Linux filesystem            
   3        41945088        62916607   10.0 GiB    8300  Linux filesystem
 
Command (? for help): n                  
Partition number (4-128, default 4):                                                
First sector (34-7501476494, default = 62916608) or {+-}size{KMGTP}:                 Last sector (62916608-7501476494, default = 7501476494) or {+-}size{KMGTP}: +10g     
Current type is 'Linux filesystem'                                                  
Hex code or GUID (L to show codes, Enter = 8300):                                   
Changed type of partition to 'Linux filesystem'                                      
 
Command (? for help): n                                                             
Partition number (5-128, default 5):                                                 
First sector (34-7501476494, default = 83888128) or {+-}size{KMGTP}:                
Last sector (83888128-7501476494, default = 7501476494) or {+-}size{KMGTP}: +10g     
Current type is 'Linux filesystem'                                             
Hex code or GUID (L to show codes, Enter = 8300):                                    Changed type of partition to 'Linux filesystem'                                
 
Command (? for help): w                                            
                                                                                     Final checks complete. About to write GPT data. THIS WILL OVERWRITE EXISTING        
PARTITIONS!!                                                                        
 
Do you want to proceed? (Y/N): y                                                     
OK; writing new GUID partition table (GPT) to /dev/sdc.                             
Warning: The kernel is still using the old partition table.                          The new table will be used at the next reboot or after you                           
run partprobe(8) or kpartx(8)                                                        
The operation has completed successfully.                                            
$ sudo gdisk /dev/nvme0n1                                                            
GPT fdisk (gdisk) version 1.0.3                                                   
 
Partition table scan:                                                                
  MBR: protective                                                              
  BSD: not present                                                             
  APM: not present                                                                   
  GPT: present                                                                
 
Found valid GPT with protective MBR; using GPT.                                     
 
Command (? for help): p                                                          
Disk /dev/nvme0n1: 7501476528 sectors, 3.5 TiB                        
Model: SAMSUNG MZQLB3T8HALS-00007                                                
Sector size (logical/physical): 512/512 bytes                                        
Disk identifier (GUID): C6F311B7-BE47-47C1-A1CB-F0A6D8C13136                        
Partition table holds up to 128 entries                                           
Main partition table begins at sector 2 and ends at sector 33                     
First usable sector is 34, last usable sector is 7501476494                          
Partitions will be aligned on 2048-sector boundaries                          
Total free space is 7438561901 sectors (3.5 TiB)                                   
 
Number  Start (sector)    End (sector)  Size       Code  Name                        
   1            2048        20973567   10.0 GiB    8300  Linux filesystem
   2        20973568        41945087   10.0 GiB    8300  Linux filesystem
   3        41945088        62916607   10.0 GiB    8300  Linux filesystem
 
Command (? for help): n
Partition number (4-128, default 4):
First sector (34-7501476494, default = 62916608) or {+-}size{KMGTP}:
Last sector (62916608-7501476494, default = 7501476494) or {+-}size{KMGTP}: +10g
Current type is 'Linux filesystem'
Hex code or GUID (L to show codes, Enter = 8300):
Changed type of partition to 'Linux filesystem'
 
Command (? for help): n
Partition number (5-128, default 5):
First sector (34-7501476494, default = 83888128) or {+-}size{KMGTP}:
Last sector (83888128-7501476494, default = 7501476494) or {+-}size{KMGTP}: +10g
Current type is 'Linux filesystem'
Hex code or GUID (L to show codes, Enter = 8300):
Changed type of partition to 'Linux filesystem'
 
Command (? for help): w
 
Final checks complete. About to write GPT data. THIS WILL OVERWRITE EXISTING
PARTITIONS!!
 
Do you want to proceed? (Y/N): y
OK; writing new GUID partition table (GPT) to /dev/nvme0n1.
Warning: The kernel is still using the old partition table.
The new table will be used at the next reboot or after you
run partprobe(8) or kpartx(8)
The operation has completed successfully.
$ sudo partprobe /dev/sdc
$ sudo partprobe /dev/nvme0n1

Array creation ^

$ sudo mdadm --create \
  --verbose \
  --assume-clean \
  /dev/md8 \
  --level=10 \
  --raid-devices=2 \
  --layout=f2 \
  /dev/sdc4 /dev/nvme0n1p4
mdadm: chunk size defaults to 512K
mdadm: size set to 10476544K
mdadm: Defaulting to version 1.2 metadata
mdadm: array /dev/md8 started.
$ sudo mdadm --create \
  --verbose \
  --assume-clean \
  /dev/md9 \
  --level=10 \
  --raid-devices=2 \
  --layout=o2 \
  /dev/sdc5 /dev/nvme0n1p5
mdadm: chunk size defaults to 512K
mdadm: size set to 10476544K
mdadm: Defaulting to version 1.2 metadata
mdadm: array /dev/md9 started.
$ cat /proc/mdstat
Personalities : [linear] [multipath] [raid0] [raid1] [raid10] [raid6] [raid5] [raid4]
 
md9 : active raid10 nvme0n1p5[1] sdc5[0]
      10476544 blocks super 1.2 512K chunks 2 offset-copies [2/2] [UU]
 
md8 : active raid10 nvme0n1p4[1] sdc4[0]
      10476544 blocks super 1.2 512K chunks 2 far-copies [2/2] [UU]
 
md7 : active raid10 sde3[1] sdd3[0]
      10476544 blocks super 1.2 2 near-copies [2/2] [UU]
 
md6 : active raid1 sde2[1] sdd2[0]
      10476544 blocks super 1.2 [2/2] [UU]
 
md5 : active raid10 nvme0n1p3[1] sdc3[0]
      10476544 blocks super 1.2 2 near-copies [2/2] [UU]
 
md4 : active raid1 nvme0n1p2[1] sdc2[0]
      10476544 blocks super 1.2 [2/2] [UU]
 
md2 : active (auto-read-only) raid10 sda3[0] sdb3[1]
      974848 blocks super 1.2 2 near-copies [2/2] [UU]
 
md0 : active raid1 sdb1[1] sda1[0]
      497664 blocks super 1.2 [2/2] [UU]
 
md1 : active raid10 sda2[0] sdb2[1]
      1950720 blocks super 1.2 2 near-copies [2/2] [UU]
 
md3 : active raid10 sda5[0] sdb5[1]
      12025856 blocks super 1.2 2 near-copies [2/2] [UU]
 
unused devices: <none>

Raw fio Output ^

Only output from the tests on the arrays with non-default output is shown here; the rest is in the previous article.

This is a lot of output and it’s the last thing in this article, so if you’re not interested in it you should stop reading now.

fast-raid10-f2_seqread: (g=0): rw=read, bs=(R) 4096B-4096B, (W) 4096B-4096B[175/9131]
B-4096B, ioengine=libaio, iodepth=32
...
fio-3.13-42-g8066f
Starting 4 processes
fast-raid10-f2_seqread: Laying out IO file (1 file / 8192MiB)
 
fast-raid10-f2_seqread: (groupid=0, jobs=4): err= 0: pid=5287: Sun Jun  2 00:18:35 20
19
  read: IOPS=244k, BW=954MiB/s (1001MB/s)(32.0GiB/34340msec)
   bw (  KiB/s): min=968176, max=984312, per=100.00%, avg=977239.00, stdev=740.55, sa
mples=272
   iops        : min=242044, max=246078, avg=244309.69, stdev=185.14, samples=272
  cpu          : usr=6.98%, sys=33.05%, ctx=738159, majf=0, minf=167
  IO depths    : 1=0.1%, 2=0.1%, 4=0.1%, 8=0.1%, 16=0.1%, 32=100.0%, >=64=0.0%
     submit    : 0=0.0%, 4=100.0%, 8=0.0%, 16=0.0%, 32=0.0%, 64=0.0%, >=64=0.0%
     complete  : 0=0.0%, 4=100.0%, 8=0.0%, 16=0.0%, 32=0.1%, 64=0.0%, >=64=0.0%
     issued rwts: total=8388608,0,0,0 short=0,0,0,0 dropped=0,0,0,0
     latency   : target=0, window=0, percentile=100.00%, depth=32
 
Run status group 0 (all jobs):
   READ: bw=954MiB/s (1001MB/s), 954MiB/s-954MiB/s (1001MB/s-1001MB/s), io=32.0GiB (3
4.4GB), run=34340-34340msec
 
Disk stats (read/write):
    md8: ios=8379702/75, merge=0/0, ticks=0/0, in_queue=0, util=0.00%, aggrios=276780
2/15, aggrmerge=1426480/64, aggrticks=618421/9, aggrin_queue=604770, aggrutil=99.93%
  nvme0n1: ios=4194304/15, merge=0/64, ticks=154683/0, in_queue=160368, util=99.93%
  sdc: ios=1341300/16, merge=2852961/64, ticks=1082160/19, in_queue=1049172, util=99.
81%
fast-raid10-o2_seqread: (g=0): rw=read, bs=(R) 4096B-4096B, (W) 4096B-4096B, (T) 4096
B-4096B, ioengine=libaio, iodepth=32
...
fio-3.13-42-g8066f
Starting 4 processes
fast-raid10-o2_seqread: Laying out IO file (1 file / 8192MiB)
 
fast-raid10-o2_seqread: (groupid=0, jobs=4): err= 0: pid=5312: Sun Jun  2 00:19:31 20
19
  read: IOPS=244k, BW=954MiB/s (1000MB/s)(32.0GiB/34358msec)
   bw (  KiB/s): min=969458, max=981640, per=100.00%, avg=976601.62, stdev=607.72, sa
mples=272
   iops        : min=242364, max=245410, avg=244150.46, stdev=151.95, samples=272
  cpu          : usr=5.91%, sys=33.95%, ctx=732590, majf=0, minf=162
  IO depths    : 1=0.1%, 2=0.1%, 4=0.1%, 8=0.1%, 16=0.1%, 32=100.0%, >=64=0.0%
     submit    : 0=0.0%, 4=100.0%, 8=0.0%, 16=0.0%, 32=0.0%, 64=0.0%, >=64=0.0%
     complete  : 0=0.0%, 4=100.0%, 8=0.0%, 16=0.0%, 32=0.1%, 64=0.0%, >=64=0.0%
     issued rwts: total=8388608,0,0,0 short=0,0,0,0 dropped=0,0,0,0
     latency   : target=0, window=0, percentile=100.00%, depth=32
 
Run status group 0 (all jobs):
   READ: bw=954MiB/s (1000MB/s), 954MiB/s-954MiB/s (1000MB/s-1000MB/s), io=32.0GiB (3
4.4GB), run=34358-34358msec
 
Disk stats (read/write):
    md9: ios=8385126/75, merge=0/0, ticks=0/0, in_queue=0, util=0.00%, aggrios=276691
0/15, aggrmerge=1427340/64, aggrticks=618657/10, aggrin_queue=606194, aggrutil=99.99%
  nvme0n1: ios=4194304/15, merge=0/64, ticks=157297/1, in_queue=163632, util=99.94%
  sdc: ios=1339516/16, merge=2854681/64, ticks=1080017/19, in_queue=1048756, util=99.
99%
fast-raid10-f2_seqwrite: (g=0): rw=write, bs=(R) 4096B-4096B, (W) 4096B-4096B, (T) 40
96B-4096B, ioengine=libaio, iodepth=32
...
fio-3.13-42-g8066f
Starting 4 processes
 
fast-raid10-f2_seqwrite: (groupid=0, jobs=4): err= 0: pid=5337: Sun Jun  2 00:21:13 2
019
  write: IOPS=82.2k, BW=321MiB/s (337MB/s)(32.0GiB/101992msec); 0 zone resets
   bw (  KiB/s): min=315288, max=336184, per=99.99%, avg=328946.06, stdev=670.42, sam
ples=812
   iops        : min=78822, max=84046, avg=82236.45, stdev=167.60, samples=812
  cpu          : usr=2.15%, sys=34.88%, ctx=973042, majf=0, minf=38
  IO depths    : 1=0.1%, 2=0.1%, 4=0.1%, 8=0.1%, 16=0.1%, 32=100.0%, >=64=0.0%
     submit    : 0=0.0%, 4=100.0%, 8=0.0%, 16=0.0%, 32=0.0%, 64=0.0%, >=64=0.0%
     complete  : 0=0.0%, 4=100.0%, 8=0.0%, 16=0.0%, 32=0.1%, 64=0.0%, >=64=0.0%
     issued rwts: total=0,8388608,0,0 short=0,0,0,0 dropped=0,0,0,0
     latency   : target=0, window=0, percentile=100.00%, depth=32
 
Run status group 0 (all jobs):
  WRITE: bw=321MiB/s (337MB/s), 321MiB/s-321MiB/s (337MB/s-337MB/s), io=32.0GiB (34.4
GB), run=101992-101992msec
 
Disk stats (read/write):                                                    [92/9131]
    md8: ios=0/8380840, merge=0/0, ticks=0/0, in_queue=0, util=0.00%, aggrios=0/83882
06, aggrmerge=0/461, aggrticks=0/704880, aggrin_queue=724510, aggrutil=100.00%
  nvme0n1: ios=0/8388649, merge=0/20, ticks=0/123227, in_queue=202792, util=100.00%
  sdc: ios=0/8387763, merge=0/902, ticks=0/1286533, in_queue=1246228, util=98.78%
fast-raid10-o2_seqwrite: (g=0): rw=write, bs=(R) 4096B-4096B, (W) 4096B-4096B, (T) 40
96B-4096B, ioengine=libaio, iodepth=32
...
fio-3.13-42-g8066f
Starting 4 processes
 
fast-raid10-o2_seqwrite: (groupid=0, jobs=4): err= 0: pid=5366: Sun Jun  2 00:22:56 2
019
  write: IOPS=82.4k, BW=322MiB/s (337MB/s)(32.0GiB/101820msec); 0 zone resets
   bw (  KiB/s): min=316248, max=420304, per=100.00%, avg=331319.30, stdev=3808.39, s
amples=807
   iops        : min=79062, max=105076, avg=82829.76, stdev=952.10, samples=807
  cpu          : usr=2.19%, sys=34.22%, ctx=975496, majf=0, minf=37
  IO depths    : 1=0.1%, 2=0.1%, 4=0.1%, 8=0.1%, 16=0.1%, 32=100.0%, >=64=0.0%
     submit    : 0=0.0%, 4=100.0%, 8=0.0%, 16=0.0%, 32=0.0%, 64=0.0%, >=64=0.0%
     complete  : 0=0.0%, 4=100.0%, 8=0.0%, 16=0.0%, 32=0.1%, 64=0.0%, >=64=0.0%
     issued rwts: total=0,8388608,0,0 short=0,0,0,0 dropped=0,0,0,0
     latency   : target=0, window=0, percentile=100.00%, depth=32
 
Run status group 0 (all jobs):
  WRITE: bw=322MiB/s (337MB/s), 322MiB/s-322MiB/s (337MB/s-337MB/s), io=32.0GiB (34.4
GB), run=101820-101820msec
 
Disk stats (read/write):
    md9: ios=0/8374085, merge=0/0, ticks=0/0, in_queue=0, util=0.00%, aggrios=0/83882
42, aggrmerge=0/442, aggrticks=0/704724, aggrin_queue=728030, aggrutil=100.00%
  nvme0n1: ios=0/8388657, merge=0/21, ticks=0/124463, in_queue=211316, util=100.00%
  sdc: ios=0/8387828, merge=0/864, ticks=0/1284985, in_queue=1244744, util=98.83%
fast-raid10-f2_randread: (g=0): rw=randread, bs=(R) 4096B-4096B, (W) 4096B-4096B, (T)
 4096B-4096B, ioengine=libaio, iodepth=32
...
fio-3.13-42-g8066f
Starting 4 processes
 
fast-raid10-f2_randread: (groupid=0, jobs=4): err= 0: pid=5412: Sun Jun  2 00:23:39 2
019
  read: IOPS=196k, BW=767MiB/s (804MB/s)(32.0GiB/42725msec)
   bw (  KiB/s): min=753863, max=816072, per=99.95%, avg=784998.94, stdev=3053.58, sa
mples=340
   iops        : min=188465, max=204018, avg=196249.72, stdev=763.40, samples=340
  cpu          : usr=4.97%, sys=25.34%, ctx=884047, majf=0, minf=161
  IO depths    : 1=0.1%, 2=0.1%, 4=0.1%, 8=0.1%, 16=0.1%, 32=100.0%, >=64=0.0%
     submit    : 0=0.0%, 4=100.0%, 8=0.0%, 16=0.0%, 32=0.0%, 64=0.0%, >=64=0.0%
     complete  : 0=0.0%, 4=100.0%, 8=0.0%, 16=0.0%, 32=0.1%, 64=0.0%, >=64=0.0%
     issued rwts: total=8388608,0,0,0 short=0,0,0,0 dropped=0,0,0,0
     latency   : target=0, window=0, percentile=100.00%, depth=32
 
Run status group 0 (all jobs):
   READ: bw=767MiB/s (804MB/s), 767MiB/s-767MiB/s (804MB/s-804MB/s), io=32.0GiB (34.4
GB), run=42725-42725msec
 
Disk stats (read/write):
    md8: ios=8371889/4, merge=0/0, ticks=0/0, in_queue=0, util=0.00%, aggrios=4191336
/15, aggrmerge=2963/1, aggrticks=1470317/6, aggrin_queue=854184, aggrutil=100.00%
  nvme0n1: ios=4194304/15, merge=0/1, ticks=317755/0, in_queue=338708, util=100.00%
  sdc: ios=4188368/16, merge=5926/2, ticks=2622880/12, in_queue=1369660, util=99.90%
fast-raid10-o2_randread: (g=0): rw=randread, bs=(R) 4096B-4096B, (W) 4096B-4096B, (T)
 4096B-4096B, ioengine=libaio, iodepth=32
...
fio-3.13-42-g8066f
Starting 4 processes
 
fast-raid10-o2_randread: (groupid=0, jobs=4): err= 0: pid=5437: Sun Jun  2 00:24:22 2
019
  read: IOPS=196k, BW=767MiB/s (804MB/s)(32.0GiB/42725msec)
   bw (  KiB/s): min=741672, max=832016, per=99.96%, avg=785051.96, stdev=4207.46, sa
mples=340
   iops        : min=185418, max=208004, avg=196262.98, stdev=1051.86, samples=340
  cpu          : usr=4.51%, sys=25.36%, ctx=886783, majf=0, minf=164
  IO depths    : 1=0.1%, 2=0.1%, 4=0.1%, 8=0.1%, 16=0.1%, 32=100.0%, >=64=0.0%
     submit    : 0=0.0%, 4=100.0%, 8=0.0%, 16=0.0%, 32=0.0%, 64=0.0%, >=64=0.0%
     complete  : 0=0.0%, 4=100.0%, 8=0.0%, 16=0.0%, 32=0.1%, 64=0.0%, >=64=0.0%
     issued rwts: total=8388608,0,0,0 short=0,0,0,0 dropped=0,0,0,0
     latency   : target=0, window=0, percentile=100.00%, depth=32
 
Run status group 0 (all jobs):
   READ: bw=767MiB/s (804MB/s), 767MiB/s-767MiB/s (804MB/s-804MB/s), io=32.0GiB (34.4
GB), run=42725-42725msec
 
Disk stats (read/write):                                                     [8/9131]
    md9: ios=8371755/4, merge=0/0, ticks=0/0, in_queue=0, util=0.00%, aggrios=4191564
/7, aggrmerge=2733/1, aggrticks=1469572/3, aggrin_queue=853154, aggrutil=100.00%
  nvme0n1: ios=4194304/7, merge=0/1, ticks=317525/0, in_queue=336088, util=100.00%
  sdc: ios=4188825/8, merge=5466/1, ticks=2621620/6, in_queue=1370220, util=99.87%
fast-raid10-f2_randwrite: (g=0): rw=randwrite, bs=(R) 4096B-4096B, (W) 4096B-4096B, (
T) 4096B-4096B, ioengine=libaio, iodepth=32
...
fio-3.13-42-g8066f
Starting 4 processes
 
fast-raid10-f2_randwrite: (groupid=0, jobs=4): err= 0: pid=5462: Sun Jun  2 00:26:04
2019
  write: IOPS=82.3k, BW=321MiB/s (337MB/s)(32.0GiB/101961msec); 0 zone resets
   bw (  KiB/s): min=318832, max=396249, per=100.00%, avg=329384.74, stdev=1762.35, s
amples=810
   iops        : min=79708, max=99061, avg=82346.02, stdev=440.57, samples=810
  cpu          : usr=2.42%, sys=34.38%, ctx=975633, majf=0, minf=39
  IO depths    : 1=0.1%, 2=0.1%, 4=0.1%, 8=0.1%, 16=0.1%, 32=100.0%, >=64=0.0%
     submit    : 0=0.0%, 4=100.0%, 8=0.0%, 16=0.0%, 32=0.0%, 64=0.0%, >=64=0.0%
     complete  : 0=0.0%, 4=100.0%, 8=0.0%, 16=0.0%, 32=0.1%, 64=0.0%, >=64=0.0%
     issued rwts: total=0,8388608,0,0 short=0,0,0,0 dropped=0,0,0,0
     latency   : target=0, window=0, percentile=100.00%, depth=32
 
Run status group 0 (all jobs):
  WRITE: bw=321MiB/s (337MB/s), 321MiB/s-321MiB/s (337MB/s-337MB/s), io=32.0GiB (34.4
GB), run=101961-101961msec
 
Disk stats (read/write):
    md8: ios=0/8383420, merge=0/0, ticks=0/0, in_queue=0, util=0.00%, aggrios=0/83886
62, aggrmerge=0/17, aggrticks=0/704633, aggrin_queue=735234, aggrutil=100.00%
  nvme0n1: ios=0/8388655, merge=0/14, ticks=0/123197, in_queue=208804, util=100.00%
  sdc: ios=0/8388669, merge=0/20, ticks=0/1286069, in_queue=1261664, util=98.75%
fast-raid10-o2_randwrite: (g=0): rw=randwrite, bs=(R) 4096B-4096B, (W) 4096B-4096B, (
T) 4096B-4096B, ioengine=libaio, iodepth=32
...
fio-3.13-42-g8066f
Starting 4 processes
 
fast-raid10-o2_randwrite: (groupid=0, jobs=4): err= 0: pid=5491: Sun Jun  2 00:27:47
2019
  write: IOPS=82.3k, BW=322MiB/s (337MB/s)(32.0GiB/101880msec); 0 zone resets
   bw (  KiB/s): min=315369, max=418520, per=100.00%, avg=330793.95, stdev=3466.64, s
amples=808
   iops        : min=78842, max=104630, avg=82698.46, stdev=866.66, samples=808
  cpu          : usr=2.21%, sys=34.38%, ctx=972875, majf=0, minf=39
  IO depths    : 1=0.1%, 2=0.1%, 4=0.1%, 8=0.1%, 16=0.1%, 32=100.0%, >=64=0.0%
     submit    : 0=0.0%, 4=100.0%, 8=0.0%, 16=0.0%, 32=0.0%, 64=0.0%, >=64=0.0%
     complete  : 0=0.0%, 4=100.0%, 8=0.0%, 16=0.0%, 32=0.1%, 64=0.0%, >=64=0.0%
     issued rwts: total=0,8388608,0,0 short=0,0,0,0 dropped=0,0,0,0
     latency   : target=0, window=0, percentile=100.00%, depth=32
 
Run status group 0 (all jobs):
  WRITE: bw=322MiB/s (337MB/s), 322MiB/s-322MiB/s (337MB/s-337MB/s), io=32.0GiB (34.4
GB), run=101880-101880msec
 
Disk stats (read/write):
    md9: ios=0/8368626, merge=0/0, ticks=0/0, in_queue=0, util=0.00%, aggrios=0/83886
67, aggrmerge=0/20, aggrticks=0/705086, aggrin_queue=732522, aggrutil=100.00%
  nvme0n1: ios=0/8388658, merge=0/19, ticks=0/123370, in_queue=209792, util=100.00%
  sdc: ios=0/8388677, merge=0/21, ticks=0/1286802, in_queue=1255252, util=98.95%

Why Linux RAID-10 sometimes performs worse than RAID-1

Background ^

In the previous article, “Linux RAID-10 may not always be the best performer, but I don’t know why“, we discovered that a RAID-10 of two mismatched drives can perform 3 times worse at random reads than a RAID-1 of the same devices.

In my case the two devices were a Samsung PM983 NVMe and a Samsung SM883 SATA SSD. The NVMe is about 6 times faster than the SSD at random reads.

An explanation ^

I posted about my findings on the linux-raid mailing list and got a very helpful reply from Guoqing Jiang.

It seems that RAID-1 has an enhancement for non-rotational devices such that it will direct IO to the least-loaded device.

For rotational devices, the distance between the location of the sectors is more important than which device is least loaded, because switching spindles has a big penalty in seeking to the correct location.

This is not so for non-rotational devices like SSD and NVMe, so if a non-rotational and lightly loaded device is available, it is selected for IO. That is why with RAID-1 I saw most of the IOs going to the fast NVME device with a corresponding boost in performance compared to RAID-10.

(click for larger)

The same enhancement has not been made for RAID-10. I do not know if this is just because no one got around to it yet, or if it’s because it may be technically harder (or impossible).

Linux RAID-10 may not always be the best performer, but I don’t know why

Background to the mystery ^

I have a server that has an SSD and an NVMe device which I intend to put into a two device RAID array. Since these devices have dramatically different performance characteristsics I did some basic tests to see which configuration would be best.

I’ve noticed that Linux’s MD RAID-10 sometimes performs much worse than MD RAID-1. This does not make much sense to me and I wondered why.

Update: the answer seems to have been found.

I’ve done some more tests and also included testing against some regular rotational HDDs just for comparison, even though I don’t intend to use them in the same way as the flash devices.

Results ^

Visuals first; testing details later. Some brief explanation of terms though.

Fast RAID
A RAID array composed of the two flash devices. One of them is an SSD and the other is an NVMe. While both of these devices are much much faster than HDDs, NVMe is again much faster than SSD so this is an imbalanced array.
Slow RAID
A RAID array composed of the two 5.4kRPM SATA HDDs. This is just for comparison. They are really, painfully, laughably slow compared to flash devices.

Charts ^

Click on the thumbnails to get a full size image. If you’re impatient, skip to the interesting bit.

Sequential IO ^

Flash devices
Reads


RAID-10 appears to work very well for sequential read IO. Remember these are mismatched devices; when reads come from both, things are not going to perform as well as the fastest device (NVMe). Still, RAID-10 achieves nearly 3.5 times the throughput of SSD alone and has some redundancy.

Why is RAID-10 1.36x faster than RAID-1 here? I’ve read that Linux RAID-10 can stripe a single process’s IO across multiple devices whereas with RAID-1 each process gets one device to read from. I’m not sure how that can apply here though, as these are 4KiB IOs which seem unlikely to be split between devices.

Looking at the raw fio output, for RAID-1 ~77% of the IOs went to the NVMe. For RAID-10 ~86% of the IOs went to the NVMe. So that is an explanation of sorts: if you get more of your IO from a faster device, your IO obviously ends up faster. It does not explain why RAID-10 is better at directing sequential IO than RAID-1 is though.

Writes


Here we can see that both kinds of RAID perform the same and definitely introduce overhead – they’re both about 72% the speed of the slowest device (the SSD). Still, for many uses you may not notice the difference, and the redundancy is required.

Rotational devices
Read


Any kind of RAID here is doing wonders for sequential read performance. I have no idea how or why RAID-10 can be over 7x faster than a single HDD. The RAID-1 is 5% slower than RAID-10 but it’s unclear if that’s significant or within bounds of test error.

It feels like a cache is involved here. Direct IO is being used but that’s only going to bypass the Linux page cache. Are the HDDs themselves caching this? They only have 128MB of cache though. Is there a read-ahead somewhere that is helping?

Write


This one is looking a lot more how I would expect. Again both RAIDs are going a little slower than the slowest device. This time it’s the RAID-10 that is about 6% faster, but again this could be within the bounds of error.

Random IO ^

Flash devices
Read


This is exactly the kind of WTF that prompted me to look into this more deeply. Why is RAID-10 about a third the random read performance of RAID-1!?

Update: the answer seems to have been found.

If using RAID-1 it is nice to see that you can pair an omg-my-wallet SSD with a slightly less omg-my-wallet NVMe and still get close to the NVMe levels of random read performance. Looking at the raw fio output, ~84% of the IOs hit the NVMe side of the mirror.

Looking at those stats for the RAID-10, the NVMe side got 53% of IOs. I don’t know if it is deliberate but I don’t think that Linux RAID-10 is able to source these IOs from the fastest device, to its massive detriment when there is such a big disparity. RAID-10 random read has ended up about twice the performance of the slowest device, but when the fastest device is more than 6 times faster than the slowest one you’d really like to get nearer to the fastest one!

Write


Things return to expectations with random writes. Both kinds of RAID perform about as fast as the slowest device, I guess because Linux has to wait for writes on both sides of the mirror to complete.

40%/60% read/write


Here RAID-10 is ~20% slower than RAID-1. I think this is because on RAID-1 the (smaller percentage of) read IOs are benefiting from whatever we see above for the pure random read test, while the (larger percentage of) write IOs are performing the same for both RAID-1 and RAID-10.

Looking at the raw fio output, for RAID-1 the NVMe device got 94% of the read IOs! They split the write IOs 50/50 as you’d expect since both sides have to have a copy written.

Looking at the output for RAID-10, the NVMe device got 50% of the read IOs. It’s easy to see why performance is lower here for RAID-10, though still not clear to me if this is by design and generally known.

This 40/60 split of read/write may seem an odd benchmarking choice but it’s actually fairly representative of our busiest VM hosting servers.

75%/25% read/write


The more usual random 75%/25% read/write test also bears out the same evidence that RAID-1 reads are happening at close to the speed of the fastest device while RAID-10 reads are happening only a bit faster than the slowest device.

Rotational devices
Read


There’s something wrong with this test. Again I suspect it’s hitting a cache somewhere because a 5.4kRPM SATA HDD is not capable of 256 IOPS! It should max out at about a quarter of this.

If someone could give me some hints as to what might be wrong with this test I’d appreciate it. To recap, it’s doing random 4KiB IO with 4 processes across an 8GiB file, so in total 32GiB will be read. In fio, the libaio engine with direct=1 is used, in an attempt to bypass Linux page cache.

Looking at the raw fio output:

  IO depths    : 1=0.1%, 2=0.1%, 4=0.1%, 8=0.1%, 16=0.1%, 32=100.0%, >=64=0.0%
     submit    : 0=0.0%, 4=100.0%, 8=0.0%, 16=0.0%, 32=0.0%, 64=0.0%, >=64=0.0%
     complete  : 0=0.0%, 4=100.0%, 8=0.0%, 16=0.0%, 32=0.1%, 64=0.0%, >=64=0.0%
     issued rwts: total=922360,0,0,0 short=0,0,0,0 dropped=0,0,0,0
     latency   : target=0, window=0, percentile=100.00%, depth=32
 
[…]
 
Disk stats (read/write):
  sdd: ios=922292/3, merge=27/1, ticks=217720971/727, in_queue=113860764, util=98.94%

So that is 922,360 read IOs issued, and 922,292 of them actually hit the disk. As far as I am aware that means close to zero of them came out Linux’s page cache; if there is caching involved does that mean it can only be the drive’s own cache?

As far as replicating this RAID-10 random read performance hole, both RAID-1 and RAID-10 sent about half the IOs to each device so it won’t show itself even if I do fix the test.

Write


Now this brings me back to the safe and comfortable (as long as I don’t have to actually live there) lands of HDD performance. I can believe that the HDD does 57 write IOPS, maybe with a little help from its own write cache. I don’t know why RAID-1 performs about a third as fast as a single device (why not the same as the slowest device?). Maybe it can’t take advantage of a write cache, and the real performance of each device is ~25 IOPS?

I am a bit concerned that again RAID-10 seems to perform worse than RAID-1. I think 16% will be beyond the bounds of testing error. The question is whether it is down to a flaw in my testing methodology. Looking at the raw fio outputs I am a bit puzzled why one HDD has much higher disk utilization values:

slow-raid1_randwrite: (g=0): rw=randwrite, bs=(R) 4096B-4096B, (W) 4096B-4096B, (T) 4096B-4096B, ioengine=libaio, iodepth=32
[…]
Disk stats (read/write):
    md6: ios=0/91688, merge=0/0, ticks=0/0, in_queue=0, util=0.00%, aggrios=0/91744, aggrmerge=0/497, aggrticks=0/44113055, aggrin_queue=4778486, aggrutil=14.52%
  sde: ios=0/91740, merge=0/502, ticks=0/7593320, in_queue=354720, util=1.31%
  sdd: ios=0/91749, merge=0/493, ticks=0/80632791, in_queue=9202252, util=14.52%
slow-raid10_randwrite: (groupid=0, jobs=4): err= 0: pid=23949: Mon May 27 14:32:34 2019
[…]
Disk stats (read/write):
    md7: ios=0/78691, merge=0/0, ticks=0/0, in_queue=0, util=0.00%, aggrios=0/78719, aggrmerge=0/506, aggrticks=0/43822275, aggrin_queue=5006454, aggrutil=15.52%
  sde: ios=0/78716, merge=0/510, ticks=0/6980884, in_queue=264756, util=1.18%
  sdd: ios=0/78723, merge=0/503, ticks=0/80663667, in_queue=9748152, util=15.52%

This actually does not happen in any of the other tests — only the random read tests — and it’s sdd both times. I don’t know if that is significant. Does it even matter as long as the disk is less than 100% utilized?

40%/60% read/write


This seems to be consistent with the random write results – RAID-10 doesn’t like random writes.

75%/25% read/write


Again consistent with the random write and the 40/60 read/write test. Here there’s fewer writes, so the RAID-10 performance gap is smaller, but it’s there.

Data tables ^

If you’re not interested in tables of stuff that you already saw pretty pictures for, skip to a summary of my confusions.

Sequential IO ^

Test Throughput (MiB/s)
SSD NVMe HDD Fast RAID-1 Fast RAID-10 Slow RAID-1 Slow RAID-10
Read 489 2,227 26 1,237 1,682 198 188
Write 447 1,754 20 321 321 18 19

Random IO ^

Test IOPS
SSD NVMe HDD Fast RAID-1 Fast RAID-10 Slow RAID-1 Slow RAID-10
Random Read 98,200 605,000 256 602,000 208,000 501 501
Random Write 86,100 435,000 74 82,200 82,200 25 21
Random 40/60 Read/Write Reads 36,300 168,000 19 53,600 43,600 25 17
Writes 54,300 252,000 29 80,400 65,300 38 26
Random 75/25 Read/Write Reads 71,000 340,000 56 176,000 110,000 84 81
Writes 23,700 113,000 18 58,600 36,700 28 27

Summary of open questions ^

Numbered for ease of clue-giving in the comments. Or on Twitter. I also made a post to the linux-raid mailing list. Even if you can’t figure out what I did wrong but have other tests you’d like to see me do, please let me know.

  1. Why is RAID-10 better at requesting sequential read IO from a faster device, such that in my tests it performed 1.36x faster than RAID-1?
  2. Why does a test of sequential read performance of HDDs achieve 28MiB/sec against a single HDD but over 7 times this for RAID? Is it because RAID uses readahead?
  3. When there is a huge disparity in device performance (e.g. 6x between SSD and NVMe), is it expected that RAID-1 is much better at using fast devices for read IO? Is there a reason why RAID-10 cannot do what RAID-1 does here?
    Answer: Yes, and unknown, respectively.
  4. What is wrong with my random read IO test against the HDDs? I should not be able to get 256 IOPS out of a single HDD. Can it possibly be disk cache, when disk cache is only 128MiB and over 3GiB was read randomly from the disk?
  5. Why does one of my HDDs show about 14% higher utilization than the other during random read tests?
  6. Why does RAID-10 appear to perform about 16% worse than RAID-1 for random writes against HDD devices?

Setup ^

Hardware ^

  • Single Xeon W-2145 CPU @ 3.7GHz
  • 256GiB memory
  • 1x Samsung SM883 SATA SSD
  • 1x Samsung PM983 NVMe
  • 2x Seagate ST5000LM000 5.4kRPM SATA HDD

Operating system ^

  • Debian buster
  • linux-image-4.19.0-4-amd64 4.19.28-2
  • mdadm – v4.1 – 2018-10-01
  • No special tweaks

Storage ^

Partitioning ^

Each of the storage devices were given three 10GiB partitions. Example partition table:

$ sudo gdisk -l /dev/sdc
GPT fdisk (gdisk) version 1.0.3
 
Partition table scan:
  MBR: protective
  BSD: not present
  APM: not present
  GPT: present
 
Found valid GPT with protective MBR; using GPT.
Disk /dev/sdc: 7501476528 sectors, 3.5 TiB
Model: SAMSUNG MZ7KH3T8
Sector size (logical/physical): 512/4096 bytes
Disk identifier (GUID): 7D7DFDA2-502C-47FE-A437-5442CCCE7E6B
Partition table holds up to 128 entries
Main partition table begins at sector 2 and ends at sector 33
First usable sector is 34, last usable sector is 7501476494
Partitions will be aligned on 2048-sector boundaries
Total free space is 7438561901 sectors (3.5 TiB)
 
Number  Start (sector)    End (sector)  Size       Code  Name
   1            2048        20973567   10.0 GiB    8300  Linux filesystem
   2        20973568        41945087   10.0 GiB    8300  Linux filesystem
   3        41945088        62916607   10.0 GiB    8300  Linux filesystem

Partition usage:

  1. Raw device
  2. RAID-1 member
  3. RAID-10 member

RAID arrays ^

RAID devices were created as follows:

$ sudo mdadm --create \
    --verbose \
    --assume-clean /dev/md4 \
    --level=1 --raid-devices=2 --size=10G \
    /dev/nvme0n1p2 /dev/sdc2
$ sudo mdadm --create \
    --verbose \
    --assume-clean /dev/md5 \
    --level=10 --raid-devices=2 --size=10G \
    /dev/nvme0n1p3 /dev/sdc3
$ sudo mdadm --create \
    --verbose \
    --assume-clean /dev/md6 \
    --level=1 --raid-devices=2 --size=10G \
    /dev/sdd2 /dev/sde2
$ sudo mdadm --create \
    --verbose \
    --assume-clean /dev/md7 \
    --level=10 --raid-devices=2 --size=10G \
    /dev/sdd3 /dev/sde3

Filesystems ^

In all cases an ext4 filesystem was created on the raw partitions and each of the RAID arrays as follows:

$ for dev in /dev/sdc1 /dev/nvme0n1p1 /dev/sdd1 /dev/md{4,5,6,7}; do \
    sudo mkfs.ext4 -E lazy_itable_init=0,lazy_journal_init=0 $dev; \
done

Testing methodology ^

All testing was done with fio. Performance of both sequential throughput and random IO was tested.

Common parameters ^

  • 4KiB IO size
  • 4 jobs
  • IO depth of 32
  • libaio IO engine
  • Direct IO (attempt to avoid Linux page cache)
  • 8GiB data file
  • 60 minute run time limit (flash devices finish their 4*8GiB workload much faster than this)
  • gtod_reduce

Sequential throughput ^

Metric reported is average throughput (MiB per second).

  • 100% read
  • 100% write

Random IO ^

Metric reported is average IO operations per second (IOPS).

The 40/60 mix is representative of the production read/write mix on our production hosts.

  • 100% read
  • 100% write
  • 40/60 read/write
  • 75/25 read/write

Full fio script ^

#!/bin/bash
 
set -eu
 
fio=/opt/fio/bin/fio
 
numjobs=4
iodepth=32
runtime=3600
 
targets=(ssd nvme hdd fast-raid1 fast-raid10 slow-raid1 slow-raid10)
 
ts=$(date --utc +%FT%TZ)
 
# seq read
for target in "${targets[@]}"; do
    $fio --name="${target}_seqread" \
        --filename="/mnt/${target}/fio" \
        --ioengine=libaio \
        --readwrite=read \
        --direct=1 \
        --numjobs=${numjobs} \
        --bs=4k \
        --iodepth=${iodepth} \
        --size=8g \
        --runtime=${runtime}s \
        --gtod_reduce=1 \
        --group_reporting | tee -a /home/andy/fio.${ts}.txt
done
 
# seq write
for target in "${targets[@]}"; do
    $fio --name="${target}_seqwrite" \
        --filename="/mnt/${target}/fio" \
        --ioengine=libaio \
        --readwrite=write \
        --direct=1 \
        --numjobs=${numjobs} \
        --bs=4k \
        --iodepth=${iodepth} \
        --size=8g \
        --runtime=${runtime}s \
        --gtod_reduce=1 \
        --group_reporting | tee -a /home/andy/fio.${ts}.txt
done
 
# random read
for target in "${targets[@]}"; do
    $fio --name="${target}_randread" \
        --filename="/mnt/${target}/fio" \
        --ioengine=libaio \
        --readwrite=randread \
        --direct=1 \
        --numjobs=${numjobs} \
        --bs=4k \
        --iodepth=${iodepth} \
        --size=8g \
        --runtime=${runtime}s \
        --gtod_reduce=1 \
        --group_reporting | tee -a /home/andy/fio.${ts}.txt
done
 
# random write
for target in "${targets[@]}"; do
    $fio --name="${target}_randwrite" \
        --filename="/mnt/${target}/fio" \
        --ioengine=libaio \
        --readwrite=randwrite \
        --direct=1 \
        --numjobs=${numjobs} \
        --bs=4k \
        --iodepth=${iodepth} \
        --size=8g \
        --runtime=${runtime}s \
        --gtod_reduce=1 \
        --group_reporting | tee -a /home/andy/fio.${ts}.txt
done
 
# 40/60 random read/write
for target in "${targets[@]}"; do
    $fio --name="${target}_rand40read" \
        --filename="/mnt/${target}/fio" \
        --ioengine=libaio \
        --readwrite=randrw \
        --rwmixread=40 \
        --direct=1 \
        --numjobs=${numjobs} \
        --bs=4k \
        --iodepth=${iodepth} \
        --size=8g \
        --runtime=${runtime}s \
        --gtod_reduce=1 \
        --group_reporting | tee -a /home/andy/fio.${ts}.txt
done
 
# 75/25 random read/write
for target in "${targets[@]}"; do
    $fio --name="${target}_rand75read" \
        --filename="/mnt/${target}/fio" \
        --ioengine=libaio \
        --readwrite=randrw \
        --rwmixread=75 \
        --direct=1 \
        --numjobs=${numjobs} \
        --bs=4k \
        --iodepth=${iodepth} \
        --size=8g \
        --runtime=${runtime}s \
        --gtod_reduce=1 \
        --group_reporting | tee -a /home/andy/fio.${ts}.txt
done

Full script output ^

This is massive and it’s also the last thing in this post, so stop reading now if you’re not interested in all the fio output.

ssd_seqread: (g=0): rw=read, bs=(R) 4096B-4096B, (W) 4096B-4096B, (T) 4096B-4096B, ioengine=libaio, iodepth=32
...
fio-3.13-42-g8066f
Starting 4 processes
 
ssd_seqread: (groupid=0, jobs=4): err= 0: pid=19203: Mon May 27 06:24:01 2019
  read: IOPS=125k, BW=489MiB/s (513MB/s)(32.0GiB/66986msec)
   bw (  KiB/s): min=498224, max=504592, per=100.00%, avg=501087.91, stdev=271.65, samples=532
   iops        : min=124556, max=126148, avg=125271.98, stdev=67.91, samples=532
  cpu          : usr=4.15%, sys=19.62%, ctx=1863599, majf=0, minf=162
  IO depths    : 1=0.1%, 2=0.1%, 4=0.1%, 8=0.1%, 16=0.1%, 32=100.0%, >=64=0.0%
     submit    : 0=0.0%, 4=100.0%, 8=0.0%, 16=0.0%, 32=0.0%, 64=0.0%, >=64=0.0%
     complete  : 0=0.0%, 4=100.0%, 8=0.0%, 16=0.0%, 32=0.1%, 64=0.0%, >=64=0.0%
     issued rwts: total=8388608,0,0,0 short=0,0,0,0 dropped=0,0,0,0
     latency   : target=0, window=0, percentile=100.00%, depth=32
 
Run status group 0 (all jobs):
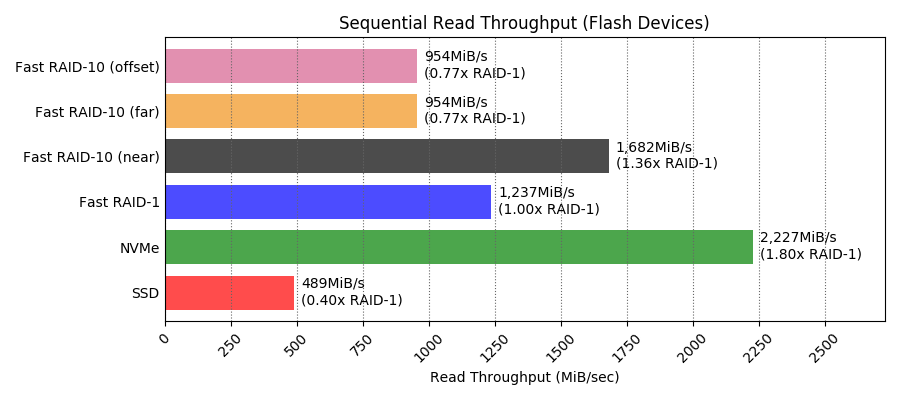
   READ: bw=489MiB/s (513MB/s), 489MiB/s-489MiB/s (513MB/s-513MB/s), io=32.0GiB (34.4GB), run=66986-66986msec
 
Disk stats (read/write):
  sdc: ios=2251963/0, merge=6127068/0, ticks=2247864/0, in_queue=2133512, util=100.00%
nvme_seqread: (g=0): rw=read, bs=(R) 4096B-4096B, (W) 4096B-4096B, (T) 4096B-4096B, ioengine=libaio, iodepth=32
...
fio-3.13-42-g8066f
Starting 4 processes
 
nvme_seqread: (groupid=0, jobs=4): err= 0: pid=19240: Mon May 27 06:24:16 2019
  read: IOPS=570k, BW=2227MiB/s (2335MB/s)(32.0GiB/14715msec)
   bw (  MiB/s): min= 2196, max= 2245, per=100.00%, avg=2227.14, stdev= 2.69, samples=116
   iops        : min=562182, max=574866, avg=570147.93, stdev=687.78, samples=116
  cpu          : usr=11.69%, sys=38.24%, ctx=3450565, majf=0, minf=166
  IO depths    : 1=0.1%, 2=0.1%, 4=0.1%, 8=0.1%, 16=0.1%, 32=100.0%, >=64=0.0%
     submit    : 0=0.0%, 4=100.0%, 8=0.0%, 16=0.0%, 32=0.0%, 64=0.0%, >=64=0.0%
     complete  : 0=0.0%, 4=100.0%, 8=0.0%, 16=0.0%, 32=0.1%, 64=0.0%, >=64=0.0%
     issued rwts: total=8388608,0,0,0 short=0,0,0,0 dropped=0,0,0,0
     latency   : target=0, window=0, percentile=100.00%, depth=32
 
Run status group 0 (all jobs):
   READ: bw=2227MiB/s (2335MB/s), 2227MiB/s-2227MiB/s (2335MB/s-2335MB/s), io=32.0GiB (34.4GB), run=14715-14715msec
 
Disk stats (read/write):
  nvme0n1: ios=8350844/0, merge=0/0, ticks=1833161/0, in_queue=2068976, util=100.00%
hdd_seqread: (g=0): rw=read, bs=(R) 4096B-4096B, (W) 4096B-4096B, (T) 4096B-4096B, ioengine=libaio, iodepth=32
...
fio-3.13-42-g8066f
Starting 4 processes
 
hdd_seqread: (groupid=0, jobs=4): err= 0: pid=19265: Mon May 27 06:45:09 2019
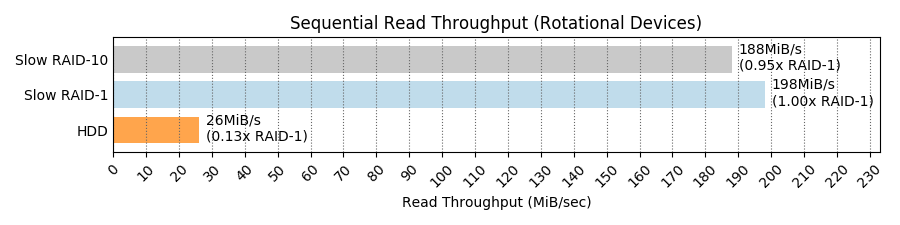
  read: IOPS=6696, BW=26.2MiB/s (27.4MB/s)(32.0GiB/1252663msec)
   bw (  KiB/s): min=20832, max=29528, per=100.00%, avg=26785.12, stdev=195.38, samples=10020
   iops        : min= 5208, max= 7382, avg=6696.23, stdev=48.85, samples=10020
  cpu          : usr=0.77%, sys=2.53%, ctx=2237416, majf=0, minf=169
  IO depths    : 1=0.1%, 2=0.1%, 4=0.1%, 8=0.1%, 16=0.1%, 32=100.0%, >=64=0.0%
     submit    : 0=0.0%, 4=100.0%, 8=0.0%, 16=0.0%, 32=0.0%, 64=0.0%, >=64=0.0%
     complete  : 0=0.0%, 4=100.0%, 8=0.0%, 16=0.0%, 32=0.1%, 64=0.0%, >=64=0.0%
     issued rwts: total=8388608,0,0,0 short=0,0,0,0 dropped=0,0,0,0
     latency   : target=0, window=0, percentile=100.00%, depth=32
 
Run status group 0 (all jobs):
   READ: bw=26.2MiB/s (27.4MB/s), 26.2MiB/s-26.2MiB/s (27.4MB/s-27.4MB/s), io=32.0GiB (34.4GB), run=1252663-1252663msec
 
Disk stats (read/write):
  sdd: ios=2161877/0, merge=6188663/0, ticks=41221865/0, in_queue=40014352, util=99.87%
fast-raid1_seqread: (g=0): rw=read, bs=(R) 4096B-4096B, (W) 4096B-4096B, (T) 4096B-4096B, ioengine=libaio, iodepth=32
...
fio-3.13-42-g8066f
Starting 4 processes
 
fast-raid1_seqread: (groupid=0, jobs=4): err= 0: pid=19567: Mon May 27 06:45:36 2019
  read: IOPS=317k, BW=1237MiB/s (1298MB/s)(32.0GiB/26481msec)
   bw (  MiB/s): min= 1190, max= 1285, per=99.98%, avg=1237.17, stdev= 5.25, samples=208
   iops        : min=304852, max=328962, avg=316715.02, stdev=1345.21, samples=208
  cpu          : usr=6.59%, sys=39.68%, ctx=1439256, majf=0, minf=164
  IO depths    : 1=0.1%, 2=0.1%, 4=0.1%, 8=0.1%, 16=0.1%, 32=100.0%, >=64=0.0%
     submit    : 0=0.0%, 4=100.0%, 8=0.0%, 16=0.0%, 32=0.0%, 64=0.0%, >=64=0.0%
     complete  : 0=0.0%, 4=100.0%, 8=0.0%, 16=0.0%, 32=0.1%, 64=0.0%, >=64=0.0%
     issued rwts: total=8388608,0,0,0 short=0,0,0,0 dropped=0,0,0,0
     latency   : target=0, window=0, percentile=100.00%, depth=32
 
Run status group 0 (all jobs):
   READ: bw=1237MiB/s (1298MB/s), 1237MiB/s-1237MiB/s (1298MB/s-1298MB/s), io=32.0GiB (34.4GB), run=26481-26481msec
 
Disk stats (read/write):
    md4: ios=8360606/0, merge=0/0, ticks=0/0, in_queue=0, util=0.00%, aggrios=3539364/0, aggrmerge=654930/0, aggrticks=1150607/0, aggrin_queue=1162162, aggrutil=100.00%
  sdc: ios=1656610/0, merge=1309860/0, ticks=833468/0, in_queue=816236, util=99.51%
  nvme0n1: ios=5422119/0, merge=0/0, ticks=1467747/0, in_queue=1508088, util=100.00%
fast-raid10_seqread: (g=0): rw=read, bs=(R) 4096B-4096B, (W) 4096B-4096B, (T) 4096B-4096B, ioengine=libaio, iodepth=32
...
fio-3.13-42-g8066f
Starting 4 processes
 
fast-raid10_seqread: (groupid=0, jobs=4): err= 0: pid=19596: Mon May 27 06:45:56 2019
  read: IOPS=431k, BW=1682MiB/s (1763MB/s)(32.0GiB/19485msec)
   bw (  MiB/s): min= 1660, max= 5369, per=100.00%, avg=2840.84, stdev=450.11, samples=107
   iops        : min=425100, max=1374556, avg=727254.32, stdev=115227.08, samples=107
  cpu          : usr=10.61%, sys=46.21%, ctx=956991, majf=0, minf=169
  IO depths    : 1=0.1%, 2=0.1%, 4=0.1%, 8=0.1%, 16=0.1%, 32=100.0%, >=64=0.0%
     submit    : 0=0.0%, 4=100.0%, 8=0.0%, 16=0.0%, 32=0.0%, 64=0.0%, >=64=0.0%
     complete  : 0=0.0%, 4=100.0%, 8=0.0%, 16=0.0%, 32=0.1%, 64=0.0%, >=64=0.0%
     issued rwts: total=8388608,0,0,0 short=0,0,0,0 dropped=0,0,0,0
     latency   : target=0, window=0, percentile=100.00%, depth=32
 
Run status group 0 (all jobs):
   READ: bw=1682MiB/s (1763MB/s), 1682MiB/s-1682MiB/s (1763MB/s-1763MB/s), io=32.0GiB (34.4GB), run=19485-19485msec
 
Disk stats (read/write):
    md5: ios=8354245/3, merge=0/0, ticks=0/0, in_queue=0, util=0.00%, aggrios=3785476/4, aggrmerge=408786/1, aggrticks=295278/4, aggrin_queue=288072, aggrutil=99.82%
  nvme0n1: ios=6479930/4, merge=0/1, ticks=46423/0, in_queue=46280, util=99.82%
  sdc: ios=1091022/5, merge=817572/1, ticks=544134/8, in_queue=529864, util=98.78%
slow-raid1_seqread: (g=0): rw=read, bs=(R) 4096B-4096B, (W) 4096B-4096B, (T) 4096B-4096B, ioengine=libaio, iodepth=32
...
fio-3.13-42-g8066f
Starting 4 processes
 
slow-raid1_seqread: (groupid=0, jobs=4): err= 0: pid=19623: Mon May 27 06:48:42 2019
  read: IOPS=50.8k, BW=198MiB/s (208MB/s)(32.0GiB/165096msec)
   bw (  KiB/s): min=120944, max=589128, per=100.00%, avg=312508.47, stdev=59646.40, samples=1011
   iops        : min=30236, max=147282, avg=78127.09, stdev=14911.62, samples=1011
  cpu          : usr=2.68%, sys=17.62%, ctx=7840715, majf=0, minf=170
  IO depths    : 1=0.1%, 2=0.1%, 4=0.1%, 8=0.1%, 16=0.1%, 32=100.0%, >=64=0.0%
     submit    : 0=0.0%, 4=100.0%, 8=0.0%, 16=0.0%, 32=0.0%, 64=0.0%, >=64=0.0%
     complete  : 0=0.0%, 4=100.0%, 8=0.0%, 16=0.0%, 32=0.1%, 64=0.0%, >=64=0.0%
     issued rwts: total=8388608,0,0,0 short=0,0,0,0 dropped=0,0,0,0
     latency   : target=0, window=0, percentile=100.00%, depth=32
 
Run status group 0 (all jobs):
   READ: bw=198MiB/s (208MB/s), 198MiB/s-198MiB/s (208MB/s-208MB/s), io=32.0GiB (34.4GB), run=165096-165096msec
 
Disk stats (read/write):
    md6: ios=8375702/4, merge=0/0, ticks=0/0, in_queue=0, util=0.00%, aggrios=3942792/8, aggrmerge=246472/1, aggrticks=5293402/364, aggrin_queue=5228076, aggrutil=99.83%
  sde: ios=5761197/8, merge=59878/1, ticks=5227721/336, in_queue=5207544, util=99.76%
  sdd: ios=2124388/8, merge=433067/1, ticks=5359084/392, in_queue=5248608, util=99.83%
slow-raid10_seqread: (g=0): rw=read, bs=(R) 4096B-4096B, (W) 4096B-4096B, (T) 4096B-4096B, ioengine=libaio, iodepth=32
...
fio-3.13-42-g8066f
Starting 4 processes
 
slow-raid10_seqread: (groupid=0, jobs=4): err= 0: pid=19672: Mon May 27 06:51:37 2019
  read: IOPS=48.1k, BW=188MiB/s (197MB/s)(32.0GiB/174318msec)
   bw (  KiB/s): min=117760, max=588752, per=100.00%, avg=285330.33, stdev=49931.94, samples=1052
   iops        : min=29440, max=147188, avg=71332.29, stdev=12482.89, samples=1052
  cpu          : usr=2.65%, sys=16.99%, ctx=7903054, majf=0, minf=162
  IO depths    : 1=0.1%, 2=0.1%, 4=0.1%, 8=0.1%, 16=0.1%, 32=100.0%, >=64=0.0%
     submit    : 0=0.0%, 4=100.0%, 8=0.0%, 16=0.0%, 32=0.0%, 64=0.0%, >=64=0.0%
     complete  : 0=0.0%, 4=100.0%, 8=0.0%, 16=0.0%, 32=0.1%, 64=0.0%, >=64=0.0%
     issued rwts: total=8388608,0,0,0 short=0,0,0,0 dropped=0,0,0,0
     latency   : target=0, window=0, percentile=100.00%, depth=32
 
Run status group 0 (all jobs):
   READ: bw=188MiB/s (197MB/s), 188MiB/s-188MiB/s (197MB/s-197MB/s), io=32.0GiB (34.4GB), run=174318-174318msec
 
Disk stats (read/write):
    md7: ios=8382423/4, merge=0/0, ticks=0/0, in_queue=0, util=0.00%, aggrios=3990234/8, aggrmerge=203371/1, aggrticks=5499680/371, aggrin_queue=5432004, aggrutil=99.83%
  sde: ios=5773992/8, merge=11192/1, ticks=5402117/359, in_queue=5381584, util=99.79%
  sdd: ios=2206477/8, merge=395550/1, ticks=5597244/383, in_queue=5482424, util=99.83%
ssd_seqwrite: (g=0): rw=write, bs=(R) 4096B-4096B, (W) 4096B-4096B, (T) 4096B-4096B, ioengine=libaio, iodepth=32
...
fio-3.13-42-g8066f
Starting 4 processes
 
ssd_seqwrite: (groupid=0, jobs=4): err= 0: pid=19725: Mon May 27 06:52:51 2019
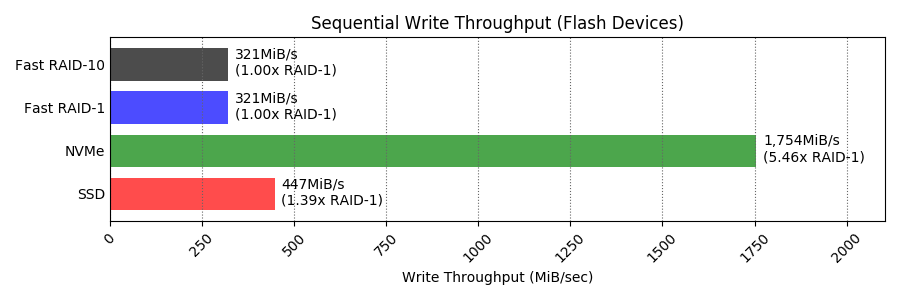
  write: IOPS=115k, BW=447MiB/s (469MB/s)(32.0GiB/73261msec); 0 zone resets
   bw (  KiB/s): min=421064, max=463912, per=100.00%, avg=458109.77, stdev=2065.39, samples=584
   iops        : min=105266, max=115978, avg=114527.41, stdev=516.35, samples=584
  cpu          : usr=3.48%, sys=21.52%, ctx=2277712, majf=0, minf=37
  IO depths    : 1=0.1%, 2=0.1%, 4=0.1%, 8=0.1%, 16=0.1%, 32=100.0%, >=64=0.0%
     submit    : 0=0.0%, 4=100.0%, 8=0.0%, 16=0.0%, 32=0.0%, 64=0.0%, >=64=0.0%
     complete  : 0=0.0%, 4=100.0%, 8=0.0%, 16=0.0%, 32=0.1%, 64=0.0%, >=64=0.0%
     issued rwts: total=0,8388608,0,0 short=0,0,0,0 dropped=0,0,0,0
     latency   : target=0, window=0, percentile=100.00%, depth=32
 
Run status group 0 (all jobs):
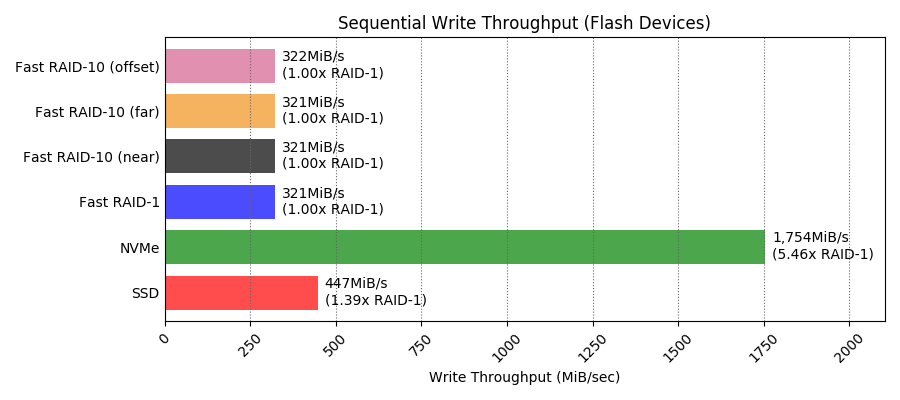
  WRITE: bw=447MiB/s (469MB/s), 447MiB/s-447MiB/s (469MB/s-469MB/s), io=32.0GiB (34.4GB), run=73261-73261msec
 
Disk stats (read/write):
  sdc: ios=0/2238107, merge=0/6047456, ticks=0/2478437, in_queue=2335432, util=99.96%
nvme_seqwrite: (g=0): rw=write, bs=(R) 4096B-4096B, (W) 4096B-4096B, (T) 4096B-4096B, ioengine=libaio, iodepth=32
...
fio-3.13-42-g8066f
Starting 4 processes
 
nvme_seqwrite: (groupid=0, jobs=4): err= 0: pid=19758: Mon May 27 06:53:10 2019
  write: IOPS=449k, BW=1754MiB/s (1839MB/s)(32.0GiB/18681msec); 0 zone resets
   bw (  MiB/s): min= 1623, max= 1857, per=99.98%, avg=1753.65, stdev=17.41, samples=148
   iops        : min=415654, max=475538, avg=448934.59, stdev=4456.41, samples=148
  cpu          : usr=8.61%, sys=56.50%, ctx=1664510, majf=0, minf=42
  IO depths    : 1=0.1%, 2=0.1%, 4=0.1%, 8=0.1%, 16=0.1%, 32=100.0%, >=64=0.0%
     submit    : 0=0.0%, 4=100.0%, 8=0.0%, 16=0.0%, 32=0.0%, 64=0.0%, >=64=0.0%
     complete  : 0=0.0%, 4=100.0%, 8=0.0%, 16=0.0%, 32=0.1%, 64=0.0%, >=64=0.0%
     issued rwts: total=0,8388608,0,0 short=0,0,0,0 dropped=0,0,0,0
     latency   : target=0, window=0, percentile=100.00%, depth=32
 
Run status group 0 (all jobs):
  WRITE: bw=1754MiB/s (1839MB/s), 1754MiB/s-1754MiB/s (1839MB/s-1839MB/s), io=32.0GiB (34.4GB), run=18681-18681msec
 
Disk stats (read/write):
  nvme0n1: ios=0/8373430, merge=0/3, ticks=0/2210464, in_queue=2410804, util=100.00%
hdd_seqwrite: (g=0): rw=write, bs=(R) 4096B-4096B, (W) 4096B-4096B, (T) 4096B-4096B, ioengine=libaio, iodepth=32
...
fio-3.13-42-g8066f
Starting 4 processes
 
hdd_seqwrite: (groupid=0, jobs=4): err= 0: pid=19786: Mon May 27 07:20:26 2019
  write: IOPS=5129, BW=20.0MiB/s (21.0MB/s)(32.0GiB/1635487msec); 0 zone resets
   bw (  KiB/s): min= 1344, max=49824, per=100.00%, avg=20526.55, stdev=2973.47, samples=13072
   iops        : min=  336, max=12456, avg=5131.58, stdev=743.37, samples=13072
  cpu          : usr=0.45%, sys=1.73%, ctx=2138826, majf=0, minf=34
  IO depths    : 1=0.1%, 2=0.1%, 4=0.1%, 8=0.1%, 16=0.1%, 32=100.0%, >=64=0.0%
     submit    : 0=0.0%, 4=100.0%, 8=0.0%, 16=0.0%, 32=0.0%, 64=0.0%, >=64=0.0%
     complete  : 0=0.0%, 4=100.0%, 8=0.0%, 16=0.0%, 32=0.1%, 64=0.0%, >=64=0.0%
     issued rwts: total=0,8388608,0,0 short=0,0,0,0 dropped=0,0,0,0
     latency   : target=0, window=0, percentile=100.00%, depth=32
 
Run status group 0 (all jobs):
  WRITE: bw=20.0MiB/s (21.0MB/s), 20.0MiB/s-20.0MiB/s (21.0MB/s-21.0MB/s), io=32.0GiB (34.4GB), run=1635487-1635487msec
 
Disk stats (read/write):
  sdd: ios=0/2151560, merge=0/6224246, ticks=0/51570499, in_queue=49570692, util=96.59%
fast-raid1_seqwrite: (g=0): rw=write, bs=(R) 4096B-4096B, (W) 4096B-4096B, (T) 4096B-4096B, ioengine=libaio, iodepth=32
...
fio-3.13-42-g8066f
Starting 4 processes
 
fast-raid1_seqwrite: (groupid=0, jobs=4): err= 0: pid=20133: Mon May 27 07:22:08 2019
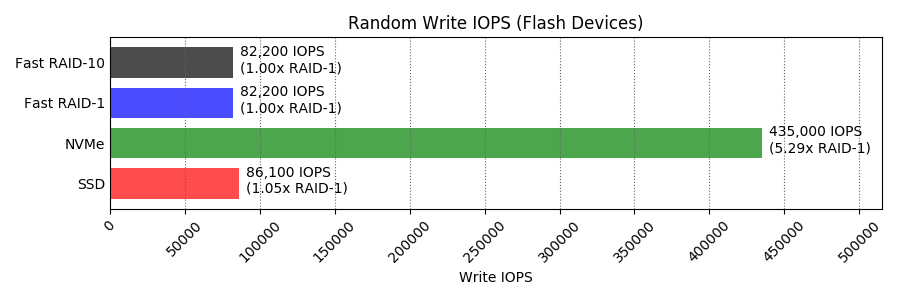
  write: IOPS=82.2k, BW=321MiB/s (337MB/s)(32.0GiB/102043msec); 0 zone resets
   bw (  KiB/s): min=309848, max=386576, per=100.00%, avg=329052.54, stdev=1516.96, samples=814
   iops        : min=77462, max=96644, avg=82263.12, stdev=379.24, samples=814
  cpu          : usr=2.33%, sys=35.15%, ctx=966557, majf=0, minf=39
  IO depths    : 1=0.1%, 2=0.1%, 4=0.1%, 8=0.1%, 16=0.1%, 32=100.0%, >=64=0.0%
     submit    : 0=0.0%, 4=100.0%, 8=0.0%, 16=0.0%, 32=0.0%, 64=0.0%, >=64=0.0%
     complete  : 0=0.0%, 4=100.0%, 8=0.0%, 16=0.0%, 32=0.1%, 64=0.0%, >=64=0.0%
     issued rwts: total=0,8388608,0,0 short=0,0,0,0 dropped=0,0,0,0
     latency   : target=0, window=0, percentile=100.00%, depth=32
 
Run status group 0 (all jobs):
  WRITE: bw=321MiB/s (337MB/s), 321MiB/s-321MiB/s (337MB/s-337MB/s), io=32.0GiB (34.4GB), run=102043-102043msec
 
Disk stats (read/write):
    md4: ios=0/8376455, merge=0/0, ticks=0/0, in_queue=0, util=0.00%, aggrios=0/8388458, aggrmerge=0/212, aggrticks=0/705526, aggrin_queue=734298, aggrutil=100.00%
  sdc: ios=0/8388268, merge=0/404, ticks=0/1288060, in_queue=1246864, util=98.49%
  nvme0n1: ios=0/8388649, merge=0/20, ticks=0/122992, in_queue=221732, util=100.00%
fast-raid10_seqwrite: (g=0): rw=write, bs=(R) 4096B-4096B, (W) 4096B-4096B, (T) 4096B-4096B, ioengine=libaio, iodepth=32
...
fio-3.13-42-g8066f
Starting 4 processes
 
fast-raid10_seqwrite: (groupid=0, jobs=4): err= 0: pid=20182: Mon May 27 07:23:51 2019
  write: IOPS=82.2k, BW=321MiB/s (337MB/s)(32.0GiB/101991msec); 0 zone resets
   bw (  KiB/s): min=319408, max=337072, per=99.99%, avg=328965.56, stdev=638.35, samples=812
   iops        : min=79852, max=84268, avg=82241.37, stdev=159.58, samples=812
  cpu          : usr=1.98%, sys=35.58%, ctx=965045, majf=0, minf=34
  IO depths    : 1=0.1%, 2=0.1%, 4=0.1%, 8=0.1%, 16=0.1%, 32=100.0%, >=64=0.0%
     submit    : 0=0.0%, 4=100.0%, 8=0.0%, 16=0.0%, 32=0.0%, 64=0.0%, >=64=0.0%
     complete  : 0=0.0%, 4=100.0%, 8=0.0%, 16=0.0%, 32=0.1%, 64=0.0%, >=64=0.0%
     issued rwts: total=0,8388608,0,0 short=0,0,0,0 dropped=0,0,0,0
     latency   : target=0, window=0, percentile=100.00%, depth=32
 
Run status group 0 (all jobs):
  WRITE: bw=321MiB/s (337MB/s), 321MiB/s-321MiB/s (337MB/s-337MB/s), io=32.0GiB (34.4GB), run=101991-101991msec
 
Disk stats (read/write):
    md5: ios=0/8380185, merge=0/0, ticks=0/0, in_queue=0, util=0.00%, aggrios=0/8388294, aggrmerge=0/387, aggrticks=0/703466, aggrin_queue=733542, aggrutil=100.00%
  nvme0n1: ios=0/8388656, merge=0/21, ticks=0/121330, in_queue=218748, util=100.00%
  sdc: ios=0/8387932, merge=0/753, ticks=0/1285603, in_queue=1248336, util=98.56%
slow-raid1_seqwrite: (g=0): rw=write, bs=(R) 4096B-4096B, (W) 4096B-4096B, (T) 4096B-4096B, ioengine=libaio, iodepth=32
...
fio-3.13-42-g8066f
Starting 4 processes
 
slow-raid1_seqwrite: (groupid=0, jobs=4): err= 0: pid=20227: Mon May 27 07:54:46 2019
  write: IOPS=4524, BW=17.7MiB/s (18.5MB/s)(32.0GiB/1854193msec); 0 zone resets
   bw (  KiB/s): min= 1023, max=109266, per=100.00%, avg=18383.76, stdev=4036.11, samples=14568
   iops        : min=  255, max=27315, avg=4595.85, stdev=1009.02, samples=14568
  cpu          : usr=0.35%, sys=3.25%, ctx=1507462, majf=0, minf=39
  IO depths    : 1=0.1%, 2=0.1%, 4=0.1%, 8=0.1%, 16=0.1%, 32=100.0%, >=64=0.0%
     submit    : 0=0.0%, 4=100.0%, 8=0.0%, 16=0.0%, 32=0.0%, 64=0.0%, >=64=0.0%
     complete  : 0=0.0%, 4=100.0%, 8=0.0%, 16=0.0%, 32=0.1%, 64=0.0%, >=64=0.0%
     issued rwts: total=0,8388608,0,0 short=0,0,0,0 dropped=0,0,0,0
     latency   : target=0, window=0, percentile=100.00%, depth=32
 
Run status group 0 (all jobs):
  WRITE: bw=17.7MiB/s (18.5MB/s), 17.7MiB/s-17.7MiB/s (18.5MB/s-18.5MB/s), io=32.0GiB (34.4GB), run=1854193-1854193msec
 
Disk stats (read/write):
    md6: ios=0/8387542, merge=0/0, ticks=0/0, in_queue=0, util=0.00%, aggrios=0/8301184, aggrmerge=0/88878, aggrticks=0/22516755, aggrin_queue=21684290, aggrutil=82.90%
  sde: ios=0/8300886, merge=0/89177, ticks=0/22832315, in_queue=21922472, util=82.90%
  sdd: ios=0/8301483, merge=0/88580, ticks=0/22201195, in_queue=21446108, util=81.09%
slow-raid10_seqwrite: (g=0): rw=write, bs=(R) 4096B-4096B, (W) 4096B-4096B, (T) 4096B-4096B, ioengine=libaio, iodepth=32
...
fio-3.13-42-g8066f
Starting 4 processes
 
slow-raid10_seqwrite: (groupid=0, jobs=4): err= 0: pid=20632: Mon May 27 08:24:04 2019
  write: IOPS=4771, BW=18.6MiB/s (19.5MB/s)(32.0GiB/1758142msec); 0 zone resets
   bw (  KiB/s): min=  304, max=123886, per=100.00%, avg=19558.79, stdev=4101.05, samples=13715
   iops        : min=   76, max=30970, avg=4889.57, stdev=1025.26, samples=13715
  cpu          : usr=0.39%, sys=3.58%, ctx=1502000, majf=0, minf=37
  IO depths    : 1=0.1%, 2=0.1%, 4=0.1%, 8=0.1%, 16=0.1%, 32=100.0%, >=64=0.0%
     submit    : 0=0.0%, 4=100.0%, 8=0.0%, 16=0.0%, 32=0.0%, 64=0.0%, >=64=0.0%
     complete  : 0=0.0%, 4=100.0%, 8=0.0%, 16=0.0%, 32=0.1%, 64=0.0%, >=64=0.0%
     issued rwts: total=0,8388608,0,0 short=0,0,0,0 dropped=0,0,0,0
     latency   : target=0, window=0, percentile=100.00%, depth=32
 
Run status group 0 (all jobs):
  WRITE: bw=18.6MiB/s (19.5MB/s), 18.6MiB/s-18.6MiB/s (19.5MB/s-19.5MB/s), io=32.0GiB (34.4GB), run=1758142-1758142msec
 
Disk stats (read/write):
    md7: ios=0/8388379, merge=0/0, ticks=0/0, in_queue=0, util=0.00%, aggrios=0/8305307, aggrmerge=0/84633, aggrticks=0/21623815, aggrin_queue=20873796, aggrutil=83.10%
  sde: ios=0/8304761, merge=0/85177, ticks=0/21726870, in_queue=20963144, util=83.10%
  sdd: ios=0/8305853, merge=0/84090, ticks=0/21520760, in_queue=20784448, util=82.48%
ssd_randread: (g=0): rw=randread, bs=(R) 4096B-4096B, (W) 4096B-4096B, (T) 4096B-4096B, ioengine=libaio, iodepth=32
...
fio-3.13-42-g8066f
Starting 4 processes
 
ssd_randread: (groupid=0, jobs=4): err= 0: pid=20854: Mon May 27 08:25:30 2019
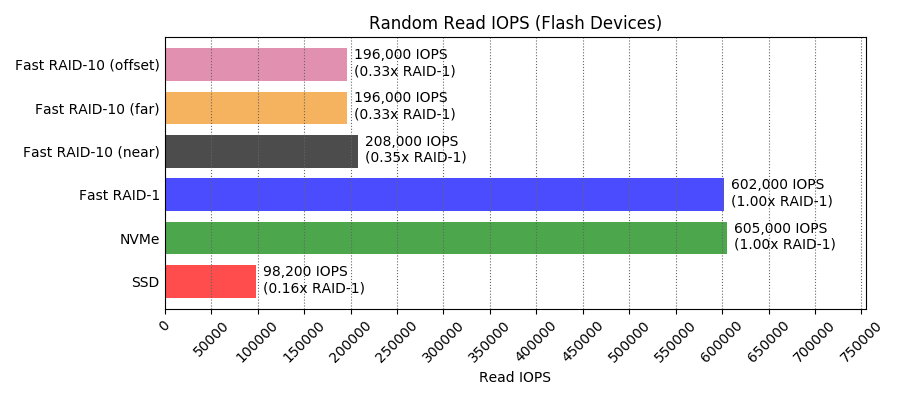
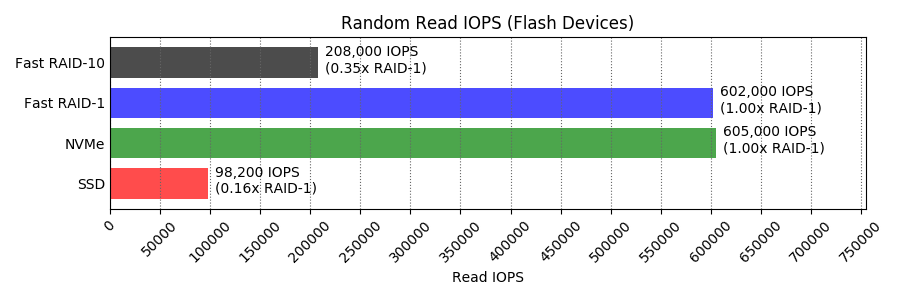
  read: IOPS=98.2k, BW=384MiB/s (402MB/s)(32.0GiB/85444msec)
   bw (  KiB/s): min=302856, max=438967, per=99.99%, avg=392684.85, stdev=6920.97, samples=679
   iops        : min=75714, max=109741, avg=98171.13, stdev=1730.24, samples=679
  cpu          : usr=2.96%, sys=16.22%, ctx=1756277, majf=0, minf=160
  IO depths    : 1=0.1%, 2=0.1%, 4=0.1%, 8=0.1%, 16=0.1%, 32=100.0%, >=64=0.0%
     submit    : 0=0.0%, 4=100.0%, 8=0.0%, 16=0.0%, 32=0.0%, 64=0.0%, >=64=0.0%
     complete  : 0=0.0%, 4=100.0%, 8=0.0%, 16=0.0%, 32=0.1%, 64=0.0%, >=64=0.0%
     issued rwts: total=8388608,0,0,0 short=0,0,0,0 dropped=0,0,0,0
     latency   : target=0, window=0, percentile=100.00%, depth=32
 
Run status group 0 (all jobs):
   READ: bw=384MiB/s (402MB/s), 384MiB/s-384MiB/s (402MB/s-402MB/s), io=32.0GiB (34.4GB), run=85444-85444msec
 
Disk stats (read/write):
  sdc: ios=8375680/3, merge=7760/1, ticks=5232536/4, in_queue=2740752, util=100.00%
nvme_randread: (g=0): rw=randread, bs=(R) 4096B-4096B, (W) 4096B-4096B, (T) 4096B-4096B, ioengine=libaio, iodepth=32
...
fio-3.13-42-g8066f
Starting 4 processes
 
nvme_randread: (groupid=0, jobs=4): err= 0: pid=20883: Mon May 27 08:25:45 2019
  read: IOPS=605k, BW=2365MiB/s (2480MB/s)(32.0GiB/13855msec)
   bw (  MiB/s): min= 2348, max= 2378, per=100.00%, avg=2365.18, stdev= 1.83, samples=108
   iops        : min=601230, max=608820, avg=605485.41, stdev=468.52, samples=108
  cpu          : usr=12.96%, sys=38.88%, ctx=3673729, majf=0, minf=159
  IO depths    : 1=0.1%, 2=0.1%, 4=0.1%, 8=0.1%, 16=0.1%, 32=100.0%, >=64=0.0%
     submit    : 0=0.0%, 4=100.0%, 8=0.0%, 16=0.0%, 32=0.0%, 64=0.0%, >=64=0.0%
     complete  : 0=0.0%, 4=100.0%, 8=0.0%, 16=0.0%, 32=0.1%, 64=0.0%, >=64=0.0%
     issued rwts: total=8388608,0,0,0 short=0,0,0,0 dropped=0,0,0,0
     latency   : target=0, window=0, percentile=100.00%, depth=32
 
Run status group 0 (all jobs):
   READ: bw=2365MiB/s (2480MB/s), 2365MiB/s-2365MiB/s (2480MB/s-2480MB/s), io=32.0GiB (34.4GB), run=13855-13855msec
 
Disk stats (read/write):
  nvme0n1: ios=8263387/2, merge=0/1, ticks=1708222/0, in_queue=1893928, util=100.00%
hdd_randread: (g=0): rw=randread, bs=(R) 4096B-4096B, (W) 4096B-4096B, (T) 4096B-4096B, ioengine=libaio, iodepth=32
...
fio-3.13-42-g8066f
Starting 4 processes
 
hdd_randread: (groupid=0, jobs=4): err= 0: pid=20908: Mon May 27 09:25:46 2019
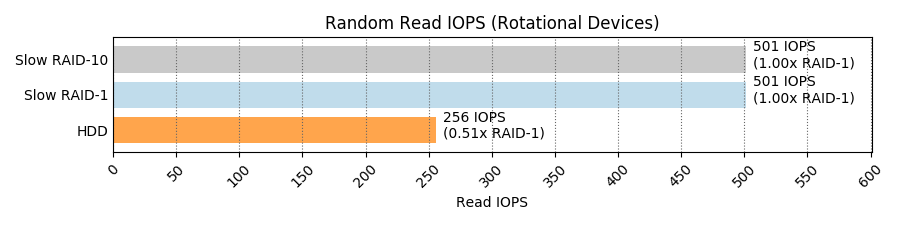
  read: IOPS=256, BW=1025KiB/s (1049kB/s)(3603MiB/3600861msec)
   bw (  KiB/s): min=  278, max= 1640, per=100.00%, avg=1024.35, stdev=30.58, samples=28804
   iops        : min=   68, max=  410, avg=255.94, stdev= 7.65, samples=28804
  cpu          : usr=0.02%, sys=0.07%, ctx=115716, majf=0, minf=163
  IO depths    : 1=0.1%, 2=0.1%, 4=0.1%, 8=0.1%, 16=0.1%, 32=100.0%, >=64=0.0%
     submit    : 0=0.0%, 4=100.0%, 8=0.0%, 16=0.0%, 32=0.0%, 64=0.0%, >=64=0.0%
     complete  : 0=0.0%, 4=100.0%, 8=0.0%, 16=0.0%, 32=0.1%, 64=0.0%, >=64=0.0%
     issued rwts: total=922360,0,0,0 short=0,0,0,0 dropped=0,0,0,0
     latency   : target=0, window=0, percentile=100.00%, depth=32
 
Run status group 0 (all jobs):
   READ: bw=1025KiB/s (1049kB/s), 1025KiB/s-1025KiB/s (1049kB/s-1049kB/s), io=3603MiB (3778MB), run=3600861-3600861msec
 
Disk stats (read/write):
  sdd: ios=922292/3, merge=27/1, ticks=217720971/727, in_queue=113860764, util=98.94%
fast-raid1_randread: (g=0): rw=randread, bs=(R) 4096B-4096B, (W) 4096B-4096B, (T) 4096B-4096B, ioengine=libaio, iodepth=32
...
fio-3.13-42-g8066f
Starting 4 processes
 
fast-raid1_randread: (groupid=0, jobs=4): err= 0: pid=21466: Mon May 27 09:26:00 2019
  read: IOPS=602k, BW=2350MiB/s (2465MB/s)(32.0GiB/13941msec)
   bw (  MiB/s): min= 2220, max= 2415, per=100.00%, avg=2354.09, stdev= 9.81, samples=108
   iops        : min=568374, max=618476, avg=602648.11, stdev=2510.22, samples=108
  cpu          : usr=10.93%, sys=52.28%, ctx=2925303, majf=0, minf=167
  IO depths    : 1=0.1%, 2=0.1%, 4=0.1%, 8=0.1%, 16=0.1%, 32=100.0%, >=64=0.0%
     submit    : 0=0.0%, 4=100.0%, 8=0.0%, 16=0.0%, 32=0.0%, 64=0.0%, >=64=0.0%
     complete  : 0=0.0%, 4=100.0%, 8=0.0%, 16=0.0%, 32=0.1%, 64=0.0%, >=64=0.0%
     issued rwts: total=8388608,0,0,0 short=0,0,0,0 dropped=0,0,0,0
     latency   : target=0, window=0, percentile=100.00%, depth=32
 
Run status group 0 (all jobs):
   READ: bw=2350MiB/s (2465MB/s), 2350MiB/s-2350MiB/s (2465MB/s-2465MB/s), io=32.0GiB (34.4GB), run=13941-13941msec
 
Disk stats (read/write):
    md4: ios=8369135/3, merge=0/0, ticks=0/0, in_queue=0, util=0.00%, aggrios=4193950/4, aggrmerge=354/1, aggrticks=857898/2, aggrin_queue=664428, aggrutil=100.00%
  sdc: ios=1367376/5, merge=708/1, ticks=868311/5, in_queue=446108, util=98.96%
  nvme0n1: ios=7020524/4, merge=0/1, ticks=847486/0, in_queue=882748, util=100.00%
fast-raid10_randread: (g=0): rw=randread, bs=(R) 4096B-4096B, (W) 4096B-4096B, (T) 4096B-4096B, ioengine=libaio, iodepth=32
...
fio-3.13-42-g8066f
Starting 4 processes
 
fast-raid10_randread: (groupid=0, jobs=4): err= 0: pid=21493: Mon May 27 09:26:41 2019
  read: IOPS=208k, BW=811MiB/s (850MB/s)(32.0GiB/40423msec)
   bw (  KiB/s): min=780328, max=899160, per=100.00%, avg=831072.62, stdev=6858.67, samples=319
   iops        : min=195082, max=224790, avg=207768.08, stdev=1714.67, samples=319
  cpu          : usr=4.65%, sys=25.53%, ctx=898971, majf=0, minf=166
  IO depths    : 1=0.1%, 2=0.1%, 4=0.1%, 8=0.1%, 16=0.1%, 32=100.0%, >=64=0.0%
     submit    : 0=0.0%, 4=100.0%, 8=0.0%, 16=0.0%, 32=0.0%, 64=0.0%, >=64=0.0%
     complete  : 0=0.0%, 4=100.0%, 8=0.0%, 16=0.0%, 32=0.1%, 64=0.0%, >=64=0.0%
     issued rwts: total=8388608,0,0,0 short=0,0,0,0 dropped=0,0,0,0
     latency   : target=0, window=0, percentile=100.00%, depth=32
 
Run status group 0 (all jobs):
   READ: bw=811MiB/s (850MB/s), 811MiB/s-811MiB/s (850MB/s-850MB/s), io=32.0GiB (34.4GB), run=40423-40423msec
 
Disk stats (read/write):
    md5: ios=8382356/4, merge=0/0, ticks=0/0, in_queue=0, util=0.00%, aggrios=4192380/10, aggrmerge=1919/1, aggrticks=1400439/5, aggrin_queue=827536, aggrutil=100.00%
  nvme0n1: ios=4420890/10, merge=0/1, ticks=340926/1, in_queue=362248, util=100.00%
  sdc: ios=3963871/11, merge=3838/1, ticks=2459952/9, in_queue=1292824, util=99.82%
slow-raid1_randread: (g=0): rw=randread, bs=(R) 4096B-4096B, (W) 4096B-4096B, (T) 4096B-4096B, ioengine=libaio, iodepth=32
...
fio-3.13-42-g8066f
Starting 4 processes
 
slow-raid1_randread: (groupid=0, jobs=4): err= 0: pid=21520: Mon May 27 10:26:42 2019
  read: IOPS=501, BW=2007KiB/s (2055kB/s)(7057MiB/3600598msec)
   bw (  KiB/s): min=  471, max= 3608, per=99.96%, avg=2006.11, stdev=90.14, samples=28804
   iops        : min=  117, max=  902, avg=501.18, stdev=22.55, samples=28804
  cpu          : usr=0.11%, sys=0.43%, ctx=976930, majf=0, minf=162
  IO depths    : 1=0.1%, 2=0.1%, 4=0.1%, 8=0.1%, 16=0.1%, 32=100.0%, >=64=0.0%
     submit    : 0=0.0%, 4=100.0%, 8=0.0%, 16=0.0%, 32=0.0%, 64=0.0%, >=64=0.0%
     complete  : 0=0.0%, 4=100.0%, 8=0.0%, 16=0.0%, 32=0.1%, 64=0.0%, >=64=0.0%
     issued rwts: total=1806648,0,0,0 short=0,0,0,0 dropped=0,0,0,0
     latency   : target=0, window=0, percentile=100.00%, depth=32
 
Run status group 0 (all jobs):
   READ: bw=2007KiB/s (2055kB/s), 2007KiB/s-2007KiB/s (2055kB/s-2055kB/s), io=7057MiB (7400MB), run=3600598-3600598msec
 
Disk stats (read/write):
    md6: ios=1806648/4, merge=0/0, ticks=0/0, in_queue=0, util=0.00%, aggrios=903297/8, aggrmerge=26/1, aggrticks=191804907/2091, aggrin_queue=110917908, aggrutil=99.11%
  sde: ios=902689/8, merge=27/1, ticks=192629122/2126, in_queue=110974004, util=99.11%
  sdd: ios=903905/8, merge=26/1, ticks=190980693/2057, in_queue=110861812, util=99.07%
slow-raid10_randread: (g=0): rw=randread, bs=(R) 4096B-4096B, (W) 4096B-4096B, (T) 4096B-4096B, ioengine=libaio, iodepth=32
...
fio-3.13-42-g8066f
Starting 4 processes
 
slow-raid10_randread: (groupid=0, jobs=4): err= 0: pid=22141: Mon May 27 11:26:43 2019
  read: IOPS=501, BW=2004KiB/s (2052kB/s)(7047MiB/3600530msec)
   bw (  KiB/s): min=  568, max= 3616, per=99.95%, avg=2002.99, stdev=89.26, samples=28801
   iops        : min=  142, max=  904, avg=500.27, stdev=22.34, samples=28801
  cpu          : usr=0.11%, sys=0.43%, ctx=981766, majf=0, minf=158
  IO depths    : 1=0.1%, 2=0.1%, 4=0.1%, 8=0.1%, 16=0.1%, 32=100.0%, >=64=0.0%
     submit    : 0=0.0%, 4=100.0%, 8=0.0%, 16=0.0%, 32=0.0%, 64=0.0%, >=64=0.0%
     complete  : 0=0.0%, 4=100.0%, 8=0.0%, 16=0.0%, 32=0.1%, 64=0.0%, >=64=0.0%
     issued rwts: total=1804024,0,0,0 short=0,0,0,0 dropped=0,0,0,0
     latency   : target=0, window=0, percentile=100.00%, depth=32
 
Run status group 0 (all jobs):
   READ: bw=2004KiB/s (2052kB/s), 2004KiB/s-2004KiB/s (2052kB/s-2052kB/s), io=7047MiB (7389MB), run=3600530-3600530msec
 
Disk stats (read/write):
    md7: ios=1804024/4, merge=0/0, ticks=0/0, in_queue=0, util=0.00%, aggrios=901984/8, aggrmerge=27/1, aggrticks=192431115/2129, aggrin_queue=111173106, aggrutil=99.17%
  sde: ios=904766/8, merge=24/1, ticks=190098507/2111, in_queue=110754216, util=99.17%
  sdd: ios=899203/8, merge=30/1, ticks=194763724/2148, in_queue=111591996, util=99.17%
ssd_randwrite: (g=0): rw=randwrite, bs=(R) 4096B-4096B, (W) 4096B-4096B, (T) 4096B-4096B, ioengine=libaio, iodepth=32
...
fio-3.13-42-g8066f
Starting 4 processes
 
ssd_randwrite: (groupid=0, jobs=4): err= 0: pid=22733: Mon May 27 11:28:21 2019
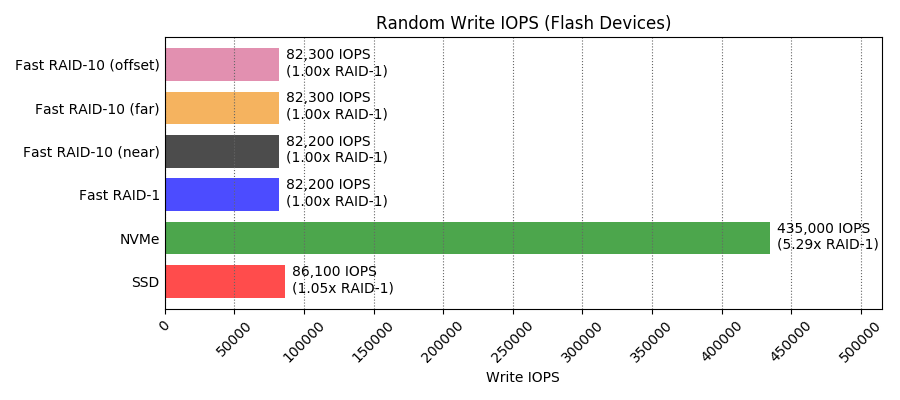
  write: IOPS=86.1k, BW=336MiB/s (353MB/s)(32.0GiB/97467msec); 0 zone resets
   bw (  KiB/s): min=317728, max=381816, per=100.00%, avg=344273.34, stdev=2458.01, samples=775
   iops        : min=79432, max=95454, avg=86068.26, stdev=614.50, samples=775
  cpu          : usr=2.91%, sys=26.62%, ctx=8245010, majf=0, minf=37
  IO depths    : 1=0.1%, 2=0.1%, 4=0.1%, 8=0.1%, 16=0.1%, 32=100.0%, >=64=0.0%
     submit    : 0=0.0%, 4=100.0%, 8=0.0%, 16=0.0%, 32=0.0%, 64=0.0%, >=64=0.0%
     complete  : 0=0.0%, 4=100.0%, 8=0.0%, 16=0.0%, 32=0.1%, 64=0.0%, >=64=0.0%
     issued rwts: total=0,8388608,0,0 short=0,0,0,0 dropped=0,0,0,0
     latency   : target=0, window=0, percentile=100.00%, depth=32
 
Run status group 0 (all jobs):
  WRITE: bw=336MiB/s (353MB/s), 336MiB/s-336MiB/s (353MB/s-353MB/s), io=32.0GiB (34.4GB), run=97467-97467msec
 
Disk stats (read/write):
  sdc: ios=0/8376016, merge=0/6243, ticks=0/5841669, in_queue=3119248, util=100.00%
nvme_randwrite: (g=0): rw=randwrite, bs=(R) 4096B-4096B, (W) 4096B-4096B, (T) 4096B-4096B, ioengine=libaio, iodepth=32
...
fio-3.13-42-g8066f
Starting 4 processes
 
nvme_randwrite: (groupid=0, jobs=4): err= 0: pid=22776: Mon May 27 11:28:41 2019
  write: IOPS=435k, BW=1698MiB/s (1780MB/s)(32.0GiB/19299msec); 0 zone resets
   bw (  MiB/s): min= 1668, max= 1727, per=100.00%, avg=1697.90, stdev= 3.49, samples=152
   iops        : min=427190, max=442344, avg=434663.08, stdev=894.54, samples=152
  cpu          : usr=10.11%, sys=53.60%, ctx=1691030, majf=0, minf=38
  IO depths    : 1=0.1%, 2=0.1%, 4=0.1%, 8=0.1%, 16=0.1%, 32=100.0%, >=64=0.0%
     submit    : 0=0.0%, 4=100.0%, 8=0.0%, 16=0.0%, 32=0.0%, 64=0.0%, >=64=0.0%
     complete  : 0=0.0%, 4=100.0%, 8=0.0%, 16=0.0%, 32=0.1%, 64=0.0%, >=64=0.0%
     issued rwts: total=0,8388608,0,0 short=0,0,0,0 dropped=0,0,0,0
     latency   : target=0, window=0, percentile=100.00%, depth=32
 
Run status group 0 (all jobs):
  WRITE: bw=1698MiB/s (1780MB/s), 1698MiB/s-1698MiB/s (1780MB/s-1780MB/s), io=32.0GiB (34.4GB), run=19299-19299msec
 
Disk stats (read/write):
  nvme0n1: ios=0/8322950, merge=0/3, ticks=0/2255895, in_queue=2510004, util=100.00%
hdd_randwrite: (g=0): rw=randwrite, bs=(R) 4096B-4096B, (W) 4096B-4096B, (T) 4096B-4096B, ioengine=libaio, iodepth=32
...
fio-3.13-42-g8066f
Starting 4 processes
 
hdd_randwrite: (groupid=0, jobs=4): err= 0: pid=22802: Mon May 27 12:28:52 2019
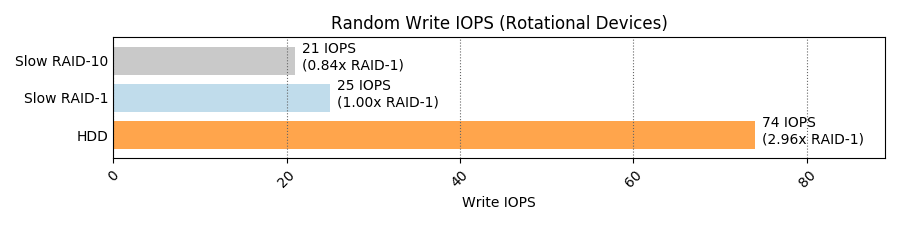
  write: IOPS=74, BW=298KiB/s (305kB/s)(1051MiB/3610638msec); 0 zone resets
   bw (  KiB/s): min=   28, max=11138, per=100.00%, avg=1200.85, stdev=596.45, samples=7165
   iops        : min=    4, max= 2784, avg=300.01, stdev=149.12, samples=7165
  cpu          : usr=0.01%, sys=0.07%, ctx=141548, majf=0, minf=34
  IO depths    : 1=0.1%, 2=0.1%, 4=0.1%, 8=0.1%, 16=0.1%, 32=100.0%, >=64=0.0%
     submit    : 0=0.0%, 4=100.0%, 8=0.0%, 16=0.0%, 32=0.0%, 64=0.0%, >=64=0.0%
     complete  : 0=0.0%, 4=100.0%, 8=0.0%, 16=0.0%, 32=0.1%, 64=0.0%, >=64=0.0%
     issued rwts: total=0,269048,0,0 short=0,0,0,0 dropped=0,0,0,0
     latency   : target=0, window=0, percentile=100.00%, depth=32
 
Run status group 0 (all jobs):
  WRITE: bw=298KiB/s (305kB/s), 298KiB/s-298KiB/s (305kB/s-305kB/s), io=1051MiB (1102MB), run=3610638-3610638msec
 
Disk stats (read/write):
  sdd: ios=0/269976, merge=0/476, ticks=0/201913479, in_queue=12552396, util=13.33%
fast-raid1_randwrite: (g=0): rw=randwrite, bs=(R) 4096B-4096B, (W) 4096B-4096B, (T) 4096B-4096B, ioengine=libaio, iodepth=32
...
fio-3.13-42-g8066f
Starting 4 processes
 
fast-raid1_randwrite: (groupid=0, jobs=4): err= 0: pid=23340: Mon May 27 12:30:35 2019
  write: IOPS=82.2k, BW=321MiB/s (337MB/s)(32.0GiB/102044msec); 0 zone resets
   bw (  KiB/s): min=310456, max=366517, per=100.00%, avg=328899.58, stdev=1230.46, samples=811
   iops        : min=77614, max=91629, avg=82224.78, stdev=307.61, samples=811
  cpu          : usr=2.49%, sys=34.63%, ctx=970337, majf=0, minf=35
  IO depths    : 1=0.1%, 2=0.1%, 4=0.1%, 8=0.1%, 16=0.1%, 32=100.0%, >=64=0.0%
     submit    : 0=0.0%, 4=100.0%, 8=0.0%, 16=0.0%, 32=0.0%, 64=0.0%, >=64=0.0%
     complete  : 0=0.0%, 4=100.0%, 8=0.0%, 16=0.0%, 32=0.1%, 64=0.0%, >=64=0.0%
     issued rwts: total=0,8388608,0,0 short=0,0,0,0 dropped=0,0,0,0
     latency   : target=0, window=0, percentile=100.00%, depth=32
 
Run status group 0 (all jobs):
  WRITE: bw=321MiB/s (337MB/s), 321MiB/s-321MiB/s (337MB/s-337MB/s), io=32.0GiB (34.4GB), run=102044-102044msec
 
Disk stats (read/write):
    md4: ios=0/8376311, merge=0/0, ticks=0/0, in_queue=0, util=0.00%, aggrios=0/8388659, aggrmerge=0/20, aggrticks=0/704846, aggrin_queue=735954, aggrutil=100.00%
  sdc: ios=0/8388669, merge=0/20, ticks=0/1287644, in_queue=1244548, util=98.44%
  nvme0n1: ios=0/8388649, merge=0/20, ticks=0/122048, in_queue=227360, util=100.00%
fast-raid10_randwrite: (g=0): rw=randwrite, bs=(R) 4096B-4096B, (W) 4096B-4096B, (T) 4096B-4096B, ioengine=libaio, iodepth=32
...
fio-3.13-42-g8066f
Starting 4 processes
 
fast-raid10_randwrite: (groupid=0, jobs=4): err= 0: pid=23379: Mon May 27 12:32:17 2019
  write: IOPS=82.2k, BW=321MiB/s (337MB/s)(32.0GiB/102002msec); 0 zone resets
   bw (  KiB/s): min=310944, max=407752, per=100.00%, avg=329334.69, stdev=2083.52, samples=810
   iops        : min=77736, max=101937, avg=82333.63, stdev=520.86, samples=810
  cpu          : usr=2.41%, sys=35.05%, ctx=960868, majf=0, minf=31
  IO depths    : 1=0.1%, 2=0.1%, 4=0.1%, 8=0.1%, 16=0.1%, 32=100.0%, >=64=0.0%
     submit    : 0=0.0%, 4=100.0%, 8=0.0%, 16=0.0%, 32=0.0%, 64=0.0%, >=64=0.0%
     complete  : 0=0.0%, 4=100.0%, 8=0.0%, 16=0.0%, 32=0.1%, 64=0.0%, >=64=0.0%
     issued rwts: total=0,8388608,0,0 short=0,0,0,0 dropped=0,0,0,0
     latency   : target=0, window=0, percentile=100.00%, depth=32
 
Run status group 0 (all jobs):
  WRITE: bw=321MiB/s (337MB/s), 321MiB/s-321MiB/s (337MB/s-337MB/s), io=32.0GiB (34.4GB), run=102002-102002msec
 
Disk stats (read/write):
    md5: ios=0/8379512, merge=0/0, ticks=0/0, in_queue=0, util=0.00%, aggrios=0/8388666, aggrmerge=0/21, aggrticks=0/704190, aggrin_queue=738060, aggrutil=100.00%
  nvme0n1: ios=0/8388656, merge=0/21, ticks=0/121112, in_queue=220276, util=100.00%
  sdc: ios=0/8388677, merge=0/21, ticks=0/1287268, in_queue=1255844, util=98.63%
slow-raid1_randwrite: (g=0): rw=randwrite, bs=(R) 4096B-4096B, (W) 4096B-4096B, (T) 4096B-4096B, ioengine=libaio, iodepth=32
...
fio-3.13-42-g8066f
Starting 4 processes
 
slow-raid1_randwrite: (groupid=0, jobs=4): err= 0: pid=23420: Mon May 27 13:32:27 2019
  write: IOPS=25, BW=100KiB/s (102kB/s)(352MiB/3608832msec); 0 zone resets
   bw (  KiB/s): min=   28, max= 7240, per=100.00%, avg=281.88, stdev=142.99, samples=10204
   iops        : min=    4, max= 1810, avg=70.09, stdev=35.76, samples=10204
  cpu          : usr=0.00%, sys=0.03%, ctx=27556, majf=0, minf=30
  IO depths    : 1=0.1%, 2=0.1%, 4=0.1%, 8=0.1%, 16=0.1%, 32=99.9%, >=64=0.0%
     submit    : 0=0.0%, 4=100.0%, 8=0.0%, 16=0.0%, 32=0.0%, 64=0.0%, >=64=0.0%
     complete  : 0=0.0%, 4=100.0%, 8=0.0%, 16=0.0%, 32=0.1%, 64=0.0%, >=64=0.0%
     issued rwts: total=0,90232,0,0 short=0,0,0,0 dropped=0,0,0,0
     latency   : target=0, window=0, percentile=100.00%, depth=32
 
Run status group 0 (all jobs):
  WRITE: bw=100KiB/s (102kB/s), 100KiB/s-100KiB/s (102kB/s-102kB/s), io=352MiB (370MB), run=3608832-3608832msec
 
Disk stats (read/write):
    md6: ios=0/91688, merge=0/0, ticks=0/0, in_queue=0, util=0.00%, aggrios=0/91744, aggrmerge=0/497, aggrticks=0/44113055, aggrin_queue=4778486, aggrutil=14.52%
  sde: ios=0/91740, merge=0/502, ticks=0/7593320, in_queue=354720, util=1.31%
  sdd: ios=0/91749, merge=0/493, ticks=0/80632791, in_queue=9202252, util=14.52%
slow-raid10_randwrite: (g=0): rw=randwrite, bs=(R) 4096B-4096B, (W) 4096B-4096B, (T) 4096B-4096B, ioengine=libaio, iodepth=32
...
fio-3.13-42-g8066f
Starting 4 processes
 
slow-raid10_randwrite: (groupid=0, jobs=4): err= 0: pid=23949: Mon May 27 14:32:34 2019
  write: IOPS=21, BW=85.6KiB/s (87.6kB/s)(301MiB/3606668msec); 0 zone resets
   bw (  KiB/s): min=   28, max= 4784, per=100.00%, avg=229.85, stdev=74.19, samples=10698
   iops        : min=    4, max= 1196, avg=57.11, stdev=18.56, samples=10698
  cpu          : usr=0.00%, sys=0.03%, ctx=25045, majf=0, minf=34
  IO depths    : 1=0.1%, 2=0.1%, 4=0.1%, 8=0.1%, 16=0.1%, 32=99.8%, >=64=0.0%
     submit    : 0=0.0%, 4=100.0%, 8=0.0%, 16=0.0%, 32=0.0%, 64=0.0%, >=64=0.0%
     complete  : 0=0.0%, 4=100.0%, 8=0.0%, 16=0.0%, 32=0.1%, 64=0.0%, >=64=0.0%
     issued rwts: total=0,77176,0,0 short=0,0,0,0 dropped=0,0,0,0
     latency   : target=0, window=0, percentile=100.00%, depth=32
 
Run status group 0 (all jobs):
  WRITE: bw=85.6KiB/s (87.6kB/s), 85.6KiB/s-85.6KiB/s (87.6kB/s-87.6kB/s), io=301MiB (316MB), run=3606668-3606668msec
 
Disk stats (read/write):
    md7: ios=0/78691, merge=0/0, ticks=0/0, in_queue=0, util=0.00%, aggrios=0/78719, aggrmerge=0/506, aggrticks=0/43822275, aggrin_queue=5006454, aggrutil=15.52%
  sde: ios=0/78716, merge=0/510, ticks=0/6980884, in_queue=264756, util=1.18%
  sdd: ios=0/78723, merge=0/503, ticks=0/80663667, in_queue=9748152, util=15.52%
ssd_rand40read: (g=0): rw=randrw, bs=(R) 4096B-4096B, (W) 4096B-4096B, (T) 4096B-4096B, ioengine=libaio, iodepth=32
...
fio-3.13-42-g8066f
Starting 4 processes
 
 
ssd_rand40read: (groupid=0, jobs=4): err= 0: pid=24459: Mon May 27 14:34:07 2019
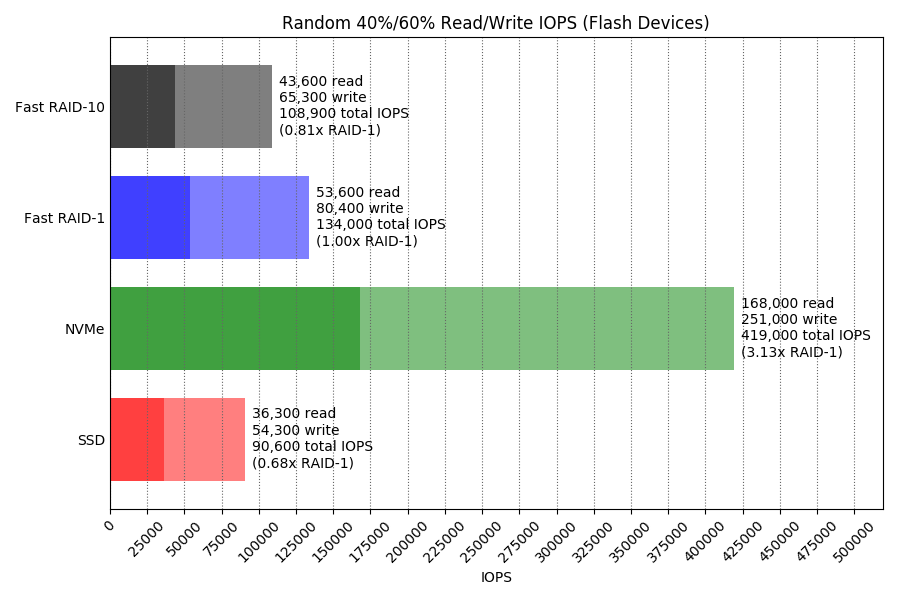
  read: IOPS=36.3k, BW=142MiB/s (148MB/s)(12.8GiB/92604msec)
   bw (  KiB/s): min=137354, max=157789, per=99.98%, avg=144980.14, stdev=914.61, samples=736
   iops        : min=34338, max=39447, avg=36244.96, stdev=228.66, samples=736
  write: IOPS=54.3k, BW=212MiB/s (223MB/s)(19.2GiB/92604msec); 0 zone resets
   bw (  KiB/s): min=207912, max=235496, per=99.98%, avg=217284.77, stdev=1277.34, samples=736
   iops        : min=51978, max=58874, avg=54321.11, stdev=319.33, samples=736
  cpu          : usr=3.47%, sys=23.54%, ctx=7633204, majf=0, minf=39
  IO depths    : 1=0.1%, 2=0.1%, 4=0.1%, 8=0.1%, 16=0.1%, 32=100.0%, >=64=0.0%
     submit    : 0=0.0%, 4=100.0%, 8=0.0%, 16=0.0%, 32=0.0%, 64=0.0%, >=64=0.0%
     complete  : 0=0.0%, 4=100.0%, 8=0.0%, 16=0.0%, 32=0.1%, 64=0.0%, >=64=0.0%
     issued rwts: total=3357227,5031381,0,0 short=0,0,0,0 dropped=0,0,0,0
     latency   : target=0, window=0, percentile=100.00%, depth=32
 
Run status group 0 (all jobs):
   READ: bw=142MiB/s (148MB/s), 142MiB/s-142MiB/s (148MB/s-148MB/s), io=12.8GiB (13.8GB), run=92604-92604msec
  WRITE: bw=212MiB/s (223MB/s), 212MiB/s-212MiB/s (223MB/s-223MB/s), io=19.2GiB (20.6GB), run=92604-92604msec
 
Disk stats (read/write):
  sdc: ios=3348978/5017641, merge=412/1987, ticks=1832516/3506648, in_queue=2964760, util=100.00%
nvme_rand40read: (g=0): rw=randrw, bs=(R) 4096B-4096B, (W) 4096B-4096B, (T) 4096B-4096B, ioengine=libaio, iodepth=32
...
fio-3.13-42-g8066f
Starting 4 processes
 
nvme_rand40read: (groupid=0, jobs=4): err= 0: pid=24494: Mon May 27 14:34:28 2019
  read: IOPS=168k, BW=655MiB/s (687MB/s)(12.8GiB/20018msec)
   bw (  KiB/s): min=648952, max=688768, per=100.00%, avg=671058.81, stdev=2513.53, samples=159
   iops        : min=162238, max=172192, avg=167764.64, stdev=628.37, samples=159
  write: IOPS=251k, BW=982MiB/s (1030MB/s)(19.2GiB/20018msec); 0 zone resets
   bw (  KiB/s): min=974008, max=1030368, per=100.00%, avg=1005678.16, stdev=3716.60, samples=159
   iops        : min=243502, max=257592, avg=251419.50, stdev=929.15, samples=159
  cpu          : usr=8.58%, sys=46.68%, ctx=6081666, majf=0, minf=37
  IO depths    : 1=0.1%, 2=0.1%, 4=0.1%, 8=0.1%, 16=0.1%, 32=100.0%, >=64=0.0%
     submit    : 0=0.0%, 4=100.0%, 8=0.0%, 16=0.0%, 32=0.0%, 64=0.0%, >=64=0.0%
     complete  : 0=0.0%, 4=100.0%, 8=0.0%, 16=0.0%, 32=0.1%, 64=0.0%, >=64=0.0%
     issued rwts: total=3357227,5031381,0,0 short=0,0,0,0 dropped=0,0,0,0
     latency   : target=0, window=0, percentile=100.00%, depth=32
 
Run status group 0 (all jobs):
   READ: bw=655MiB/s (687MB/s), 655MiB/s-655MiB/s (687MB/s-687MB/s), io=12.8GiB (13.8GB), run=20018-20018msec
  WRITE: bw=982MiB/s (1030MB/s), 982MiB/s-982MiB/s (1030MB/s-1030MB/s), io=19.2GiB (20.6GB), run=20018-20018msec
 
Disk stats (read/write):
  nvme0n1: ios=3337290/5001689, merge=0/3, ticks=1181649/890715, in_queue=2237796, util=100.00%
hdd_rand40read: (g=0): rw=randrw, bs=(R) 4096B-4096B, (W) 4096B-4096B, (T) 4096B-4096B, ioengine=libaio, iodepth=32
...
fio-3.13-42-g8066f
Starting 4 processes
 
hdd_rand40read: (groupid=0, jobs=4): err= 0: pid=24517: Mon May 27 15:34:29 2019
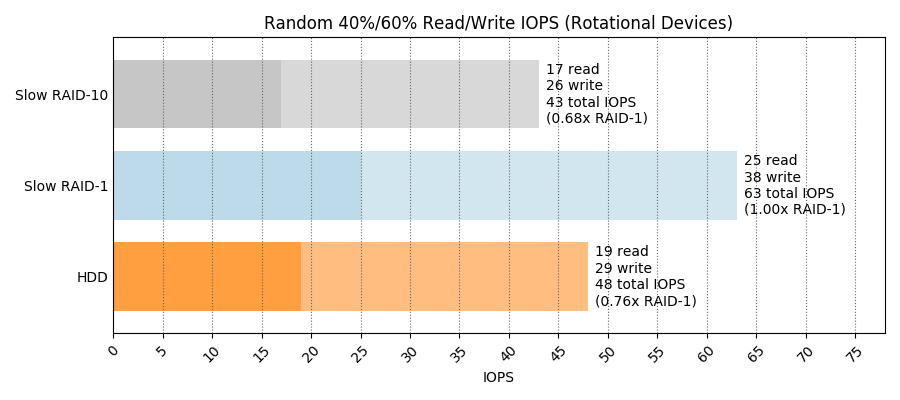
  read: IOPS=19, BW=77.5KiB/s (79.3kB/s)(273MiB/3601333msec)
   bw (  KiB/s): min=   28, max= 1016, per=100.00%, avg=184.05, stdev=37.32, samples=12089
   iops        : min=    4, max=  254, avg=45.65, stdev= 9.33, samples=12089
  write: IOPS=29, BW=116KiB/s (119kB/s)(408MiB/3601333msec); 0 zone resets
   bw (  KiB/s): min=   28, max= 1518, per=100.00%, avg=246.94, stdev=53.96, samples=13515
   iops        : min=    4, max=  378, avg=61.37, stdev=13.48, samples=13515
  cpu          : usr=0.01%, sys=0.04%, ctx=147402, majf=0, minf=34
  IO depths    : 1=0.1%, 2=0.1%, 4=0.1%, 8=0.1%, 16=0.1%, 32=99.9%, >=64=0.0%
     submit    : 0=0.0%, 4=100.0%, 8=0.0%, 16=0.0%, 32=0.0%, 64=0.0%, >=64=0.0%
     complete  : 0=0.0%, 4=100.0%, 8=0.0%, 16=0.0%, 32=0.1%, 64=0.0%, >=64=0.0%
     issued rwts: total=69764,104564,0,0 short=0,0,0,0 dropped=0,0,0,0
     latency   : target=0, window=0, percentile=100.00%, depth=32
 
Run status group 0 (all jobs):
   READ: bw=77.5KiB/s (79.3kB/s), 77.5KiB/s-77.5KiB/s (79.3kB/s-79.3kB/s), io=273MiB (286MB), run=3601333-3601333msec
  WRITE: bw=116KiB/s (119kB/s), 116KiB/s-116KiB/s (119kB/s-119kB/s), io=408MiB (428MB), run=3601333-3601333msec
 
Disk stats (read/write):
  sdd: ios=69754/105816, merge=0/638, ticks=60387351/139632687, in_queue=34094648, util=38.38%
fast-raid1_rand40read: (g=0): rw=randrw, bs=(R) 4096B-4096B, (W) 4096B-4096B, (T) 4096B-4096B, ioengine=libaio, iodepth=32
...
fio-3.13-42-g8066f
Starting 4 processes
 
fast-raid1_rand40read: (groupid=0, jobs=4): err= 0: pid=24996: Mon May 27 15:35:33 2019
  read: IOPS=53.6k, BW=210MiB/s (220MB/s)(12.8GiB/62577msec)
   bw (  KiB/s): min=203040, max=225448, per=99.99%, avg=214565.85, stdev=864.07, samples=496
   iops        : min=50760, max=56362, avg=53641.38, stdev=216.01, samples=496
  write: IOPS=80.4k, BW=314MiB/s (329MB/s)(19.2GiB/62577msec); 0 zone resets
   bw (  KiB/s): min=306304, max=334360, per=99.99%, avg=321567.38, stdev=960.94, samples=496
   iops        : min=76576, max=83590, avg=80391.76, stdev=240.24, samples=496
  cpu          : usr=3.93%, sys=38.31%, ctx=6189944, majf=0, minf=31
  IO depths    : 1=0.1%, 2=0.1%, 4=0.1%, 8=0.1%, 16=0.1%, 32=100.0%, >=64=0.0%
     submit    : 0=0.0%, 4=100.0%, 8=0.0%, 16=0.0%, 32=0.0%, 64=0.0%, >=64=0.0%
     complete  : 0=0.0%, 4=100.0%, 8=0.0%, 16=0.0%, 32=0.1%, 64=0.0%, >=64=0.0%
     issued rwts: total=3357227,5031381,0,0 short=0,0,0,0 dropped=0,0,0,0
     latency   : target=0, window=0, percentile=100.00%, depth=32
 
Run status group 0 (all jobs):
   READ: bw=210MiB/s (220MB/s), 210MiB/s-210MiB/s (220MB/s-220MB/s), io=12.8GiB (13.8GB), run=62577-62577msec
  WRITE: bw=314MiB/s (329MB/s), 314MiB/s-314MiB/s (329MB/s-329MB/s), io=19.2GiB (20.6GB), run=62577-62577msec
 
Disk stats (read/write):
    md4: ios=3347484/5016809, merge=0/0, ticks=0/0, in_queue=0, util=0.00%, aggrios=1678613/5031412, aggrmerge=0/12, aggrticks=203582/449275, aggrin_queue=667070, aggrutil=100.00%
  sdc: ios=214068/5031418, merge=0/12, ticks=55301/827759, in_queue=870720, util=99.41%
  nvme0n1: ios=3143159/5031406, merge=0/12, ticks=351863/70792, in_queue=463420, util=100.00%
fast-raid10_rand40read: (g=0): rw=randrw, bs=(R) 4096B-4096B, (W) 4096B-4096B, (T) 4096B-4096B, ioengine=libaio, iodepth=32
...
fio-3.13-42-g8066f
Starting 4 processes
 
fast-raid10_rand40read: (groupid=0, jobs=4): err= 0: pid=25027: Mon May 27 15:36:50 2019
  read: IOPS=43.6k, BW=170MiB/s (178MB/s)(12.8GiB/77071msec)
   bw (  KiB/s): min=165472, max=184784, per=99.99%, avg=174214.65, stdev=1009.55, samples=612
   iops        : min=41368, max=46196, avg=43553.61, stdev=252.39, samples=612
  write: IOPS=65.3k, BW=255MiB/s (267MB/s)(19.2GiB/77071msec); 0 zone resets
   bw (  KiB/s): min=250816, max=274536, per=99.99%, avg=261091.16, stdev=1363.52, samples=612
   iops        : min=62704, max=68634, avg=65272.73, stdev=340.88, samples=612
  cpu          : usr=3.59%, sys=34.08%, ctx=6235718, majf=0, minf=37
  IO depths    : 1=0.1%, 2=0.1%, 4=0.1%, 8=0.1%, 16=0.1%, 32=100.0%, >=64=0.0%
     submit    : 0=0.0%, 4=100.0%, 8=0.0%, 16=0.0%, 32=0.0%, 64=0.0%, >=64=0.0%
     complete  : 0=0.0%, 4=100.0%, 8=0.0%, 16=0.0%, 32=0.1%, 64=0.0%, >=64=0.0%
     issued rwts: total=3357227,5031381,0,0 short=0,0,0,0 dropped=0,0,0,0
     latency   : target=0, window=0, percentile=100.00%, depth=32
 
Run status group 0 (all jobs):
   READ: bw=170MiB/s (178MB/s), 170MiB/s-170MiB/s (178MB/s-178MB/s), io=12.8GiB (13.8GB), run=77071-77071msec
  WRITE: bw=255MiB/s (267MB/s), 255MiB/s-255MiB/s (267MB/s-267MB/s), io=19.2GiB (20.6GB), run=77071-77071msec
 
Disk stats (read/write):
    md5: ios=3349230/5019464, merge=0/0, ticks=0/0, in_queue=0, util=0.00%, aggrios=1678605/5031368, aggrmerge=7/75, aggrticks=375482/535122, aggrin_queue=907140, aggrutil=100.00%
  nvme0n1: ios=1683181/5031419, merge=0/16, ticks=173697/68306, in_queue=286432, util=100.00%
  sdc: ios=1674030/5031317, merge=15/134, ticks=577268/1001938, in_queue=1527848, util=100.00%
slow-raid1_rand40read: (g=0): rw=randrw, bs=(R) 4096B-4096B, (W) 4096B-4096B, (T) 4096B-4096B, ioengine=libaio, iodepth=32
...
fio-3.13-42-g8066f
Starting 4 processes
 
slow-raid1_rand40read: (groupid=0, jobs=4): err= 0: pid=25058: Mon May 27 16:36:51 2019
  read: IOPS=25, BW=102KiB/s (104kB/s)(359MiB/3600363msec)
   bw (  KiB/s): min=   28, max= 1567, per=100.00%, avg=190.82, stdev=48.94, samples=15352
   iops        : min=    4, max=  391, avg=47.44, stdev=12.23, samples=15352
  write: IOPS=38, BW=154KiB/s (157kB/s)(540MiB/3600363msec); 0 zone resets
   bw (  KiB/s): min=   28, max= 2408, per=100.00%, avg=262.88, stdev=75.86, samples=16781
   iops        : min=    4, max=  602, avg=65.46, stdev=18.96, samples=16781
  cpu          : usr=0.01%, sys=0.07%, ctx=170981, majf=0, minf=36
  IO depths    : 1=0.1%, 2=0.1%, 4=0.1%, 8=0.1%, 16=0.1%, 32=99.9%, >=64=0.0%
     submit    : 0=0.0%, 4=100.0%, 8=0.0%, 16=0.0%, 32=0.0%, 64=0.0%, >=64=0.0%
     complete  : 0=0.0%, 4=100.0%, 8=0.0%, 16=0.0%, 32=0.1%, 64=0.0%, >=64=0.0%
     issued rwts: total=91801,138207,0,0 short=0,0,0,0 dropped=0,0,0,0
     latency   : target=0, window=0, percentile=100.00%, depth=32
 
Run status group 0 (all jobs):
   READ: bw=102KiB/s (104kB/s), 102KiB/s-102KiB/s (104kB/s-104kB/s), io=359MiB (376MB), run=3600363-3600363msec
  WRITE: bw=154KiB/s (157kB/s), 154KiB/s-154KiB/s (157kB/s-157kB/s), io=540MiB (566MB), run=3600363-3600363msec
 
Disk stats (read/write):
    md6: ios=91779/140158, merge=0/0, ticks=0/0, in_queue=0, util=0.00%, aggrios=45900/140208, aggrmerge=0/656, aggrticks=14202214/30211957, aggrin_queue=12491444, aggrutil=48.18%
  sde: ios=39664/140200, merge=0/664, ticks=2840484/5209092, in_queue=2804348, util=9.82%
  sdd: ios=52137/140216, merge=0/648, ticks=25563944/55214822, in_queue=22178540, util=48.18%
slow-raid10_rand40read: (g=0): rw=randrw, bs=(R) 4096B-4096B, (W) 4096B-4096B, (T) 4096B-4096B, ioengine=libaio, iodepth=32
...
fio-3.13-42-g8066f
Starting 4 processes
 
slow-raid10_rand40read: (groupid=0, jobs=4): err= 0: pid=25714: Mon May 27 17:37:04 2019
  read: IOPS=17, BW=70.0KiB/s (71.7kB/s)(247MiB/3612868msec)
   bw (  KiB/s): min=   27, max= 1216, per=100.00%, avg=162.19, stdev=41.06, samples=12423
   iops        : min=    4, max=  304, avg=40.09, stdev=10.27, samples=12423
  write: IOPS=26, BW=105KiB/s (108kB/s)(371MiB/3612868msec); 0 zone resets
   bw (  KiB/s): min=   27, max= 2024, per=100.00%, avg=223.10, stdev=64.70, samples=13569
   iops        : min=    4, max=  506, avg=55.32, stdev=16.17, samples=13569
  cpu          : usr=0.01%, sys=0.05%, ctx=122921, majf=0, minf=39
  IO depths    : 1=0.1%, 2=0.1%, 4=0.1%, 8=0.1%, 16=0.1%, 32=99.9%, >=64=0.0%
     submit    : 0=0.0%, 4=100.0%, 8=0.0%, 16=0.0%, 32=0.0%, 64=0.0%, >=64=0.0%
     complete  : 0=0.0%, 4=100.0%, 8=0.0%, 16=0.0%, 32=0.1%, 64=0.0%, >=64=0.0%
     issued rwts: total=63249,94951,0,0 short=0,0,0,0 dropped=0,0,0,0
     latency   : target=0, window=0, percentile=100.00%, depth=32
 
Run status group 0 (all jobs):
   READ: bw=70.0KiB/s (71.7kB/s), 70.0KiB/s-70.0KiB/s (71.7kB/s-71.7kB/s), io=247MiB (259MB), run=3612868-3612868msec
  WRITE: bw=105KiB/s (108kB/s), 105KiB/s-105KiB/s (108kB/s-108kB/s), io=371MiB (389MB), run=3612868-3612868msec
 
Disk stats (read/write):
    md7: ios=63249/96781, merge=0/0, ticks=0/0, in_queue=0, util=0.00%, aggrios=31624/96881, aggrmerge=0/522, aggrticks=15497107/37413184, aggrin_queue=10284966, aggrutil=35.60%
  sde: ios=27131/96796, merge=0/608, ticks=8770894/25815301, in_queue=5907956, util=18.62%
  sdd: ios=36118/96966, merge=0/436, ticks=22223321/49011067, in_queue=14661976, util=35.60%
ssd_rand75read: (g=0): rw=randrw, bs=(R) 4096B-4096B, (W) 4096B-4096B, (T) 4096B-4096B, ioengine=libaio, iodepth=32
...
fio-3.13-42-g8066f
Starting 4 processes
 
ssd_rand75read: (groupid=0, jobs=4): err= 0: pid=26527: Mon May 27 17:38:33 2019
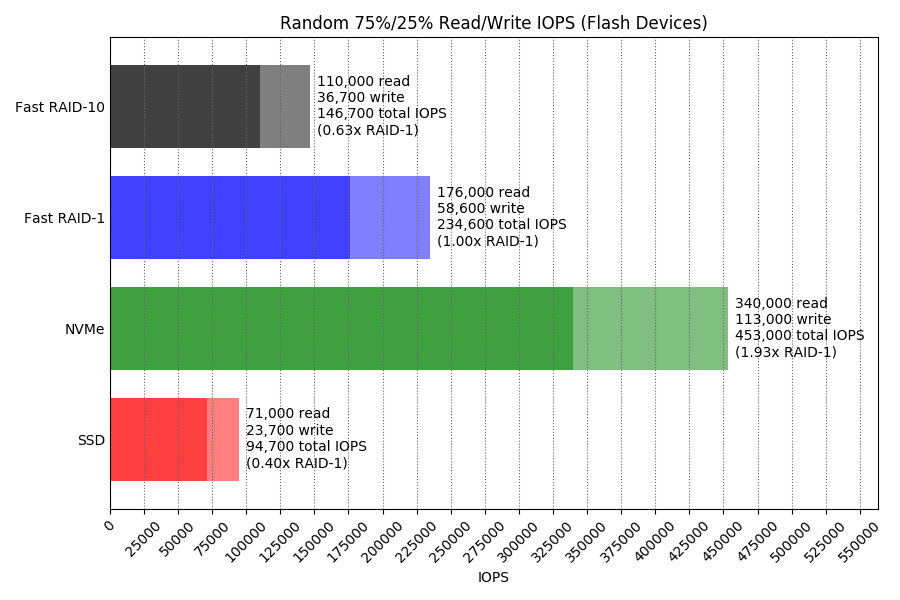
  read: IOPS=71.0k, BW=278MiB/s (291MB/s)(23.0GiB/88532msec)
   bw (  KiB/s): min=255176, max=491472, per=100.00%, avg=287151.98, stdev=8804.16, samples=697
   iops        : min=63794, max=122866, avg=71787.92, stdev=2201.03, samples=697
  write: IOPS=23.7k, BW=92.6MiB/s (97.1MB/s)(8198MiB/88532msec); 0 zone resets
   bw (  KiB/s): min=83320, max=165016, per=100.00%, avg=95816.08, stdev=2959.11, samples=697
   iops        : min=20830, max=41254, avg=23953.99, stdev=739.78, samples=697
  cpu          : usr=3.84%, sys=20.61%, ctx=5531570, majf=0, minf=34
  IO depths    : 1=0.1%, 2=0.1%, 4=0.1%, 8=0.1%, 16=0.1%, 32=100.0%, >=64=0.0%
     submit    : 0=0.0%, 4=100.0%, 8=0.0%, 16=0.0%, 32=0.0%, 64=0.0%, >=64=0.0%
     complete  : 0=0.0%, 4=100.0%, 8=0.0%, 16=0.0%, 32=0.1%, 64=0.0%, >=64=0.0%
     issued rwts: total=6290017,2098591,0,0 short=0,0,0,0 dropped=0,0,0,0
     latency   : target=0, window=0, percentile=100.00%, depth=32
 
Run status group 0 (all jobs):
   READ: bw=278MiB/s (291MB/s), 278MiB/s-278MiB/s (291MB/s-291MB/s), io=23.0GiB (25.8GB), run=88532-88532msec
  WRITE: bw=92.6MiB/s (97.1MB/s), 92.6MiB/s-92.6MiB/s (97.1MB/s-97.1MB/s), io=8198MiB (8596MB), run=88532-88532msec
 
Disk stats (read/write):
  sdc: ios=6276704/2094912, merge=3430/421, ticks=3570460/1234860, in_queue=2836220, util=100.00%
nvme_rand75read: (g=0): rw=randrw, bs=(R) 4096B-4096B, (W) 4096B-4096B, (T) 4096B-4096B, ioengine=libaio, iodepth=32
...
fio-3.13-42-g8066f
Starting 4 processes
 
nvme_rand75read: (groupid=0, jobs=4): err= 0: pid=26568: Mon May 27 17:38:52 2019
  read: IOPS=340k, BW=1327MiB/s (1391MB/s)(23.0GiB/18522msec)
   bw (  MiB/s): min= 1294, max= 1356, per=100.00%, avg=1326.84, stdev= 4.07, samples=147
   iops        : min=331282, max=347170, avg=339670.68, stdev=1041.42, samples=147
  write: IOPS=113k, BW=443MiB/s (464MB/s)(8198MiB/18522msec); 0 zone resets
   bw (  KiB/s): min=438432, max=465144, per=100.00%, avg=453358.86, stdev=1646.16, samples=147
   iops        : min=109608, max=116286, avg=113339.71, stdev=411.56, samples=147
  cpu          : usr=10.14%, sys=46.86%, ctx=5103055, majf=0, minf=40
  IO depths    : 1=0.1%, 2=0.1%, 4=0.1%, 8=0.1%, 16=0.1%, 32=100.0%, >=64=0.0%
     submit    : 0=0.0%, 4=100.0%, 8=0.0%, 16=0.0%, 32=0.0%, 64=0.0%, >=64=0.0%
     complete  : 0=0.0%, 4=100.0%, 8=0.0%, 16=0.0%, 32=0.1%, 64=0.0%, >=64=0.0%
     issued rwts: total=6290017,2098591,0,0 short=0,0,0,0 dropped=0,0,0,0
     latency   : target=0, window=0, percentile=100.00%, depth=32
 
Run status group 0 (all jobs):
   READ: bw=1327MiB/s (1391MB/s), 1327MiB/s-1327MiB/s (1391MB/s-1391MB/s), io=23.0GiB (25.8GB), run=18522-18522msec
  WRITE: bw=443MiB/s (464MB/s), 443MiB/s-443MiB/s (464MB/s-464MB/s), io=8198MiB (8596MB), run=18522-18522msec
 
Disk stats (read/write):
  nvme0n1: ios=6248647/2084929, merge=0/3, ticks=1873327/160609, in_queue=2202800, util=100.00%
hdd_rand75read: (g=0): rw=randrw, bs=(R) 4096B-4096B, (W) 4096B-4096B, (T) 4096B-4096B, ioengine=libaio, iodepth=32
...
fio-3.13-42-g8066f
Starting 4 processes
 
hdd_rand75read: (groupid=0, jobs=4): err= 0: pid=26596: Mon May 27 18:38:55 2019
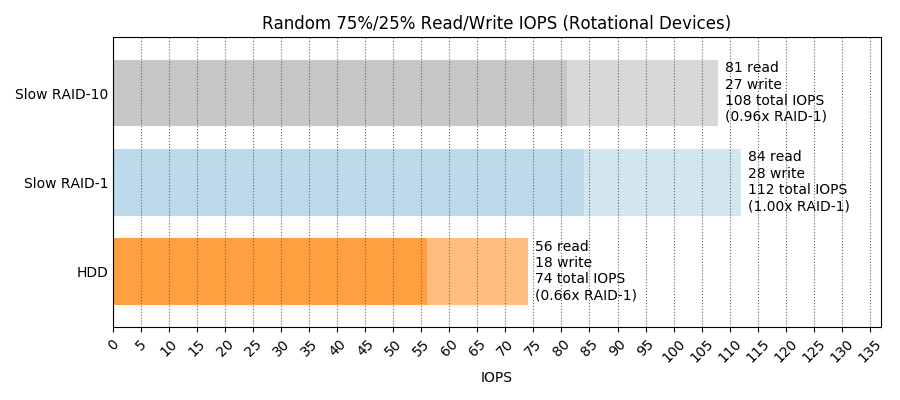
  read: IOPS=56, BW=226KiB/s (231kB/s)(794MiB/3602251msec)
   bw (  KiB/s): min=   28, max= 1448, per=100.00%, avg=418.58, stdev=77.89, samples=15527
   iops        : min=    4, max=  362, avg=104.55, stdev=19.47, samples=15527
  write: IOPS=18, BW=75.6KiB/s (77.4kB/s)(266MiB/3602251msec); 0 zone resets
   bw (  KiB/s): min=   28, max=  728, per=100.00%, avg=171.33, stdev=30.27, samples=12702
   iops        : min=    4, max=  182, avg=42.73, stdev= 7.57, samples=12702
  cpu          : usr=0.01%, sys=0.05%, ctx=186498, majf=0, minf=39
  IO depths    : 1=0.1%, 2=0.1%, 4=0.1%, 8=0.1%, 16=0.1%, 32=100.0%, >=64=0.0%
     submit    : 0=0.0%, 4=100.0%, 8=0.0%, 16=0.0%, 32=0.0%, 64=0.0%, >=64=0.0%
     complete  : 0=0.0%, 4=100.0%, 8=0.0%, 16=0.0%, 32=0.1%, 64=0.0%, >=64=0.0%
     issued rwts: total=203244,68108,0,0 short=0,0,0,0 dropped=0,0,0,0
     latency   : target=0, window=0, percentile=100.00%, depth=32
 
Run status group 0 (all jobs):
   READ: bw=226KiB/s (231kB/s), 226KiB/s-226KiB/s (231kB/s-231kB/s), io=794MiB (832MB), run=3602251-3602251msec
  WRITE: bw=75.6KiB/s (77.4kB/s), 75.6KiB/s-75.6KiB/s (77.4kB/s-77.4kB/s), io=266MiB (279MB), run=3602251-3602251msec
 
Disk stats (read/write):
  sdd: ios=203238/69356, merge=3/630, ticks=136092993/55058765, in_queue=45116208, util=48.88%
fast-raid1_rand75read: (g=0): rw=randrw, bs=(R) 4096B-4096B, (W) 4096B-4096B, (T) 4096B-4096B, ioengine=libaio, iodepth=32
...
fio-3.13-42-g8066f
Starting 4 processes
 
fast-raid1_rand75read: (groupid=0, jobs=4): err= 0: pid=27367: Mon May 27 18:39:32 2019
  read: IOPS=176k, BW=686MiB/s (719MB/s)(23.0GiB/35835msec)
   bw (  KiB/s): min=660240, max=717336, per=99.98%, avg=701957.38, stdev=2252.52, samples=284
   iops        : min=165060, max=179334, avg=175489.34, stdev=563.13, samples=284
  write: IOPS=58.6k, BW=229MiB/s (240MB/s)(8198MiB/35835msec); 0 zone resets
   bw (  KiB/s): min=222680, max=240808, per=100.00%, avg=234241.37, stdev=724.34, samples=284
   iops        : min=55670, max=60202, avg=58560.31, stdev=181.09, samples=284
  cpu          : usr=5.87%, sys=43.43%, ctx=4398551, majf=0, minf=35
  IO depths    : 1=0.1%, 2=0.1%, 4=0.1%, 8=0.1%, 16=0.1%, 32=100.0%, >=64=0.0%
     submit    : 0=0.0%, 4=100.0%, 8=0.0%, 16=0.0%, 32=0.0%, 64=0.0%, >=64=0.0%
     complete  : 0=0.0%, 4=100.0%, 8=0.0%, 16=0.0%, 32=0.1%, 64=0.0%, >=64=0.0%
     issued rwts: total=6290017,2098591,0,0 short=0,0,0,0 dropped=0,0,0,0
     latency   : target=0, window=0, percentile=100.00%, depth=32
 
Run status group 0 (all jobs):
   READ: bw=686MiB/s (719MB/s), 686MiB/s-686MiB/s (719MB/s-719MB/s), io=23.0GiB (25.8GB), run=35835-35835msec
  WRITE: bw=229MiB/s (240MB/s), 229MiB/s-229MiB/s (240MB/s-240MB/s), io=8198MiB (8596MB), run=35835-35835msec
 
Disk stats (read/write):
    md4: ios=6256195/2087439, merge=0/0, ticks=0/0, in_queue=0, util=0.00%, aggrios=3144990/2098586, aggrmerge=18/30, aggrticks=475920/253361, aggrin_queue=725774, aggrutil=100.00%
  sdc: ios=1046956/2098567, merge=36/53, ticks=367915/478540, in_queue=802572, util=99.83%
  nvme0n1: ios=5243025/2098606, merge=0/7, ticks=583926/28183, in_queue=648976, util=100.00%
fast-raid10_rand75read: (g=0): rw=randrw, bs=(R) 4096B-4096B, (W) 4096B-4096B, (T) 4096B-4096B, ioengine=libaio, iodepth=32
...
fio-3.13-42-g8066f
Starting 4 processes
 
fast-raid10_rand75read: (groupid=0, jobs=4): err= 0: pid=27399: Mon May 27 18:40:29 2019
  read: IOPS=110k, BW=430MiB/s (451MB/s)(23.0GiB/57145msec)
   bw (  KiB/s): min=414080, max=620144, per=100.00%, avg=441721.99, stdev=7481.88, samples=451
   iops        : min=103520, max=155036, avg=110430.45, stdev=1870.47, samples=451
  write: IOPS=36.7k, BW=143MiB/s (150MB/s)(8198MiB/57145msec); 0 zone resets
   bw (  KiB/s): min=137224, max=206440, per=100.00%, avg=147385.78, stdev=2467.32, samples=451
   iops        : min=34306, max=51610, avg=36846.38, stdev=616.83, samples=451
  cpu          : usr=4.38%, sys=31.09%, ctx=4625955, majf=0, minf=37
  IO depths    : 1=0.1%, 2=0.1%, 4=0.1%, 8=0.1%, 16=0.1%, 32=100.0%, >=64=0.0%
     submit    : 0=0.0%, 4=100.0%, 8=0.0%, 16=0.0%, 32=0.0%, 64=0.0%, >=64=0.0%
     complete  : 0=0.0%, 4=100.0%, 8=0.0%, 16=0.0%, 32=0.1%, 64=0.0%, >=64=0.0%
     issued rwts: total=6290017,2098591,0,0 short=0,0,0,0 dropped=0,0,0,0
     latency   : target=0, window=0, percentile=100.00%, depth=32
 
Run status group 0 (all jobs):
   READ: bw=430MiB/s (451MB/s), 430MiB/s-430MiB/s (451MB/s-451MB/s), io=23.0GiB (25.8GB), run=57145-57145msec
  WRITE: bw=143MiB/s (150MB/s), 143MiB/s-143MiB/s (150MB/s-150MB/s), io=8198MiB (8596MB), run=57145-57145msec
 
Disk stats (read/write):
    md5: ios=6289620/2098512, merge=0/0, ticks=0/0, in_queue=0, util=0.00%, aggrios=3144679/2098476, aggrmerge=329/162, aggrticks=901109/410843, aggrin_queue=980248, aggrutil=100.00%
  nvme0n1: ios=3177529/2098621, merge=0/12, ticks=301788/24926, in_queue=373208, util=100.00%
  sdc: ios=3111830/2098332, merge=658/313, ticks=1500430/796760, in_queue=1587288, util=100.00%
slow-raid1_rand75read: (g=0): rw=randrw, bs=(R) 4096B-4096B, (W) 4096B-4096B, (T) 4096B-4096B, ioengine=libaio, iodepth=32
...
fio-3.13-42-g8066f
Starting 4 processes
 
slow-raid1_rand75read: (groupid=0, jobs=4): err= 0: pid=27428: Mon May 27 19:40:34 2019
  read: IOPS=84, BW=337KiB/s (346kB/s)(1188MiB/3604229msec)
   bw (  KiB/s): min=   28, max= 2486, per=100.00%, avg=540.41, stdev=119.45, samples=17980
   iops        : min=    4, max=  621, avg=134.68, stdev=29.86, samples=17980
  write: IOPS=28, BW=113KiB/s (116kB/s)(398MiB/3604229msec); 0 zone resets
   bw (  KiB/s): min=   28, max= 1087, per=100.00%, avg=215.17, stdev=45.43, samples=15087
   iops        : min=    4, max=  271, avg=53.36, stdev=11.36, samples=15087
  cpu          : usr=0.01%, sys=0.08%, ctx=213113, majf=0, minf=34
  IO depths    : 1=0.1%, 2=0.1%, 4=0.1%, 8=0.1%, 16=0.1%, 32=100.0%, >=64=0.0%
     submit    : 0=0.0%, 4=100.0%, 8=0.0%, 16=0.0%, 32=0.0%, 64=0.0%, >=64=0.0%
     complete  : 0=0.0%, 4=100.0%, 8=0.0%, 16=0.0%, 32=0.1%, 64=0.0%, >=64=0.0%
     issued rwts: total=304053,101763,0,0 short=0,0,0,0 dropped=0,0,0,0
     latency   : target=0, window=0, percentile=100.00%, depth=32
 
Run status group 0 (all jobs):
   READ: bw=337KiB/s (346kB/s), 337KiB/s-337KiB/s (346kB/s-346kB/s), io=1188MiB (1245MB), run=3604229-3604229msec
  WRITE: bw=113KiB/s (116kB/s), 113KiB/s-113KiB/s (116kB/s-116kB/s), io=398MiB (417MB), run=3604229-3604229msec
 
Disk stats (read/write):
    md6: ios=304053/103780, merge=0/0, ticks=0/0, in_queue=0, util=0.00%, aggrios=152025/103790, aggrmerge=1/663, aggrticks=50772659/28311543, aggrin_queue=23973600, aggrutil=53.64%
  sde: ios=143654/103782, merge=2/671, ticks=17259120/5776421, in_queue=12313572, util=23.68%
  sdd: ios=160396/103798, merge=1/655, ticks=84286199/50846665, in_queue=35633628, util=53.64%
slow-raid10_rand75read: (g=0): rw=randrw, bs=(R) 4096B-4096B, (W) 4096B-4096B, (T) 4096B-4096B, ioengine=libaio, iodepth=32
...
fio-3.13-42-g8066f
Starting 4 processes
 
slow-raid10_rand75read: (groupid=0, jobs=4): err= 0: pid=28197: Mon May 27 20:40:45 2019
  read: IOPS=81, BW=328KiB/s (336kB/s)(1156MiB/3610270msec)
   bw (  KiB/s): min=   28, max= 2568, per=100.00%, avg=508.77, stdev=109.01, samples=18593
   iops        : min=    4, max=  642, avg=127.05, stdev=27.25, samples=18593
  write: IOPS=27, BW=110KiB/s (112kB/s)(386MiB/3610270msec); 0 zone resets
   bw (  KiB/s): min=   28, max= 1048, per=100.00%, avg=200.66, stdev=41.08, samples=15746
   iops        : min=    4, max=  262, avg=50.02, stdev=10.27, samples=15746
  cpu          : usr=0.01%, sys=0.07%, ctx=208409, majf=0, minf=37
  IO depths    : 1=0.1%, 2=0.1%, 4=0.1%, 8=0.1%, 16=0.1%, 32=100.0%, >=64=0.0%
     submit    : 0=0.0%, 4=100.0%, 8=0.0%, 16=0.0%, 32=0.0%, 64=0.0%, >=64=0.0%
     complete  : 0=0.0%, 4=100.0%, 8=0.0%, 16=0.0%, 32=0.1%, 64=0.0%, >=64=0.0%
     issued rwts: total=295820,98860,0,0 short=0,0,0,0 dropped=0,0,0,0
     latency   : target=0, window=0, percentile=100.00%, depth=32
 
Run status group 0 (all jobs):
   READ: bw=328KiB/s (336kB/s), 328KiB/s-328KiB/s (336kB/s-336kB/s), io=1156MiB (1212MB), run=3610270-3610270msec
  WRITE: bw=110KiB/s (112kB/s), 110KiB/s-110KiB/s (112kB/s-112kB/s), io=386MiB (405MB), run=3610270-3610270msec
 
Disk stats (read/write):
    md7: ios=295820/100895, merge=0/0, ticks=0/0, in_queue=0, util=0.00%, aggrios=147908/100940, aggrmerge=1/642, aggrticks=51356785/29919840, aggrin_queue=24559964, aggrutil=53.42%
  sde: ios=137873/100905, merge=2/677, ticks=26306419/13385259, in_queue=14197356, util=28.45%
  sdd: ios=157944/100976, merge=1/607, ticks=76407151/46454421, in_queue=34922572, util=53.42%

Disabling the default IPMI credentials on a Supermicro server

In an earlier post I mentioned that you should disable the default ADMIN / ADMIN credentials on the IPMI controller. Here’s how.

Install ipmitool ^

ipmitool is the utility that you will use from the command line of another machine in order to interact with the IPMI controllers on your servers.

# apt-get install ipmitool

List the current users ^

$ ipmitool -I lanplus -H 192.168.1.22 -U ADMIN -a user list
Password:
ID  Name             Callin  Link Auth  IPMI Msg   Channel Priv Limit
2   ADMIN            false   false      true       ADMINISTRATOR

Here you are specifying the IP address of the server’s IPMI controller. ADMIN is the IPMI user name you will use to log in, and it’s prompting you for the password which is also ADMIN by default.

Add a new user ^

You should add a new user with a name other than ADMIN.

I suppose it would be safe to just change the password of the existing ADMIN user, but there is no need to have it named that, so you may as well pick a new name.

$ ipmitool -I lanplus -H 192.168.1.22 -U ADMIN -a user set name 3 somename
Password:
$ ipmitool -I lanplus -H 192.168.1.22 -U ADMIN -a user set password 3
Password:
Password for user 3:
$ ipmitool -I lanplus -H 192.168.1.22 -U ADMIN -a channel setaccess 1 3 link=on ipmi=on callin=on privilege=4
Password:
$ ipmitool -I lanplus -H 192.168.1.22 -U ADMIN -a user enable 3
Password:

From this point on you can switch to using the new user instead.

$ ipmitool -I lanplus -H 192.168.1.22 -U somename -a user list
Password:
ID  Name             Callin  Link Auth  IPMI Msg   Channel Priv Limit
2   ADMIN            false   false      true       ADMINISTRATOR
3   somename         true    true       true       ADMINISTRATOR

Disable ADMIN user ^

Before doing this bit you may wish to check that the new user you added works for everything you need it to. Those things might include:

  • ssh to somename@192.168.1.22
  • Log in on web interface at https://192.168.1.22/
  • Various ipmitool commands like querying power status:
    $ ipmitool -I lanplus -H 192.168.1.22 -U somename -a power status
    Password:
    Chassis power is on

If all of that is okay then you can disable ADMIN:

$ ipmitool -I lanplus -H 192.168.1.22 -U somename -a user disable 2
Password:

If you are paranoid (or this is just the first time you’ve done this) you could now check to see that none of the above things now work when you try to use ADMIN / ADMIN.

Specifying the password ^

I have not done so in these examples but if you get bored of typing the password every time then you could put it in the IPMI_PASSWORD environment variable and use -E instead of -a on the ipmitool command line.

When setting the IPMI_PASSWORD environment variable you probably don’t want it logged in your shell’s history file. Depending on which shell you use there may be different ways to achieve that.

With bash, if you have ignorespace in the HISTCONTROL environment variable then commands prefixed by one or more spaces won’t be logged. Alternatively you could temporarily disable history logging with:

$ set +o history
$ sensitive commend goes here
$ set -o history # re-enable history logging

So anyway…

$ echo $HISTCONTROL
ignoredups:ignorespace
$     export IPMI_PASSWORD=letmein
$ # ^ note the leading spaces here
$ # to prevent the shell logging it
$ ipmitool -I lanplus -H 192.168.1.22 -U somename -E power status
Chassis Power is on

Installing Debian by PXE using Supermicro IPMI Serial over LAN

Here’s how to install Debian jessie on a Supermicro server using PXE boot and the IPMI serial-over-LAN.

Using these instructions you will be able to complete an install of a remote machine, although you will initially need access to the BIOS to configure the IPMI part.

BIOS settings ^

This bit needs you to be in the same location as the machine, or else have someone who is make the required changes.

Press DEL to go into the BIOS configuration.

Under Advanced > PCIe/PCI/PnP Configuration make sure that the network interface through which you’ll reach your PXE server has the “PXE” option ROM set:

BIOS PSE option ROM

Under Advanced > Serial Port Console Redirection you’ll want to enable SOL Console Redirection.

BIOS serial console redirection

(Pictured here is also COM1 Console Redirection. This is for the physical serial port on the machine, not the one in the IPMI.)

Under SOL Console Redirection Settings you may as well set the Bits per second to 115200.

BIOS SOL redirection settings

Now it’s time to configure the IPMI so you can interact with it over the network. Under IPMI > BMC Network Configuration, put the IPMI on your management network:

IPMI network configuration

Connecting to the IPMI serial ^

With the above BIOS settings in place you should be able to save and reboot and then connect to the IPMI serial console. The default credentials are ADMIn / ADMIN which you should of course change with ipmitool, but that is for a different post.

There’s two ways to connect to the serial-over-LAN: You can ssh to the IPMI controller, or you can use ipmitool. Personally I prefer ssh, but the ipmitool way is like this:

$ ipmitool -I lanplus -H 192.168.1.22 -U ADMIN -a sol activate

The ssh way:

$ ssh ADMIN@192.168.1.22
The authenticity of host '192.168.1.22 (192.168.1.22)' can't be established.
RSA key fingerprint is b7:e1:12:94:37:81:fc:f7:db:6f:1c:00:e4:e0:e1:c4.
Are you sure you want to continue connecting (yes/no)?
Warning: Permanently added '192.168.1.22,192.168.1.22' (RSA) to the list of known hosts.
ADMIN@192.168.1.22's password:
 
ATEN SMASH-CLP System Management Shell, version 1.05
Copyright (c) 2008-2009 by ATEN International CO., Ltd.
All Rights Reserved 
 
 
-> cd /system1/sol1
/system1/sol1
 
-> start
/system1/sol1
press <Enter>, <Esc>, and then <T> to terminate session
(press the keys in sequence, one after the other)

They both end up displaying basically the same thing.

The serial console should just be displaying the boot process, which won’t go anywhere.

DHCP and TFTP server ^

You will need to configure a DHCP and TFTP server on an already-existing machine on the same LAN as your new server. They can both run on the same host.

The DHCP server responds to the initial requests for IP address configuration and passes along where to get the boot environment from. The TFTP server serves up that boot environment. The boot environment here consists of a kernel, initramfs and some configuration for passing arguments to the bootloader/kernel. The boot environment is provided by the Debian project.

DHCP ^

I’m using isc-dhcp-server. Its configuration file is at /etc/dhcp/dhcpd.conf.

You’ll need to know the MAC address of the server, which can be obtained either from the front page of the IPMI controller’s web interface (i.e. https://192.168.1.22/ in this case) or else it is displayed on the serial console when it attempts to do a PXE boot. So, add a section for that:

subnet 192.168.2.0 netmask 255.255.255.0 {
}
 
host foo {
    hardware ethernet 0C:C4:7A:7C:28:40;
    fixed-address 192.168.2.22;
    filename "pxelinux.0";
    next-server 192.168.2.251;
    option subnet-mask 255.255.255.0;
    option routers 192.168.2.1;
}

Here we set the network configuration of the new server with fixed-address, option subnet-mask and option routers. The IP address in next-server refers to the IP address of the TFTP server, and pxelinux.0 is what the new server will download from it.

Make sure that is running:

# service isc-dhcp-server start

DHCP uses UDP port 67, so make sure that is allowed through your firewall.

TFTP ^

A number of different TFTP servers are available. I use tftpd-hpa, which is mostly configured by variables in /etc/default/tftp-hpa:

TFTP_OPTIONS="--secure"
TFTP_USERNAME="tftp"
TFTP_DIRECTORY="/srv/tftp"
TFTP_ADDRESS="0.0.0.0:69"

TFTP_DIRECTORY is where you’ll put the files for the PXE environment.

Make sure that the TFTP server is running:

# service tftpd-hpa start

TFTP uses UDP port 69, so make sure that is allowed through your firewall.

Download the netboot files from your local Debian mirror:

$ cd /srv/tftp
$ curl -s http://ftp.YOUR-MIRROR.debian.org/debian/dists/jessie/main/installer-amd64/current/images/netboot/netboot.tar.gz | sudo tar zxvf -
./                
./version.info    
./ldlinux.c32     
./pxelinux.0      
./pxelinux.cfg    
./debian-installer/
./debian-installer/amd64/
./debian-installer/amd64/bootnetx64.efi
./debian-installer/amd64/grub/
./debian-installer/amd64/grub/grub.cfg
./debian-installer/amd64/grub/font.pf2
…

(This assumes you are installing a device with architecture amd64.)

At this point your TFTP server root should contain a debian-installer subdirectory and a couple of links into it:

$ ls -l .
total 8
drwxrwxr-x 3 root root 4096 Jun  4  2015 debian-installer
lrwxrwxrwx 1 root root   47 Jun  4  2015 ldlinux.c32 -> debian-installer/amd64/boot-screens/ldlinux.c32
lrwxrwxrwx 1 root root   33 Jun  4  2015 pxelinux.0 -> debian-installer/amd64/pxelinux.0
lrwxrwxrwx 1 root root   35 Jun  4  2015 pxelinux.cfg -> debian-installer/amd64/pxelinux.cfg
-rw-rw-r-- 1 root root   61 Jun  4  2015 version.info

You could now boot your server and it would call out to PXE to do its netboot, but would be displaying the installer process on the VGA output. If you intend to carry it out using the Remote Console facility of the IPMI interface then that may be good enough. If you want to do it over the serial-over-LAN though, you’ll need to edit some of the files that came out of the netboot.tar.gz to configure that.

Here’s a list of the files you need to edit. All you are doing in each one is telling it to use serial console. The changes are quite mechanical so you can easily come up with a script to do it, but here I will show the changes verbosely. All the files live in the debian-installer/amd64/boot-screens/ directory.

ttyS1 is used here because this system has a real serial port on ttyS0. 115200 is the baud rate of ttyS1 as configured in the BIOS earlier.

adtxt.cfg

From:

label expert
        menu label ^Expert install
        kernel debian-installer/amd64/linux
        append priority=low vga=788 initrd=debian-installer/amd64/initrd.gz --- 
include debian-installer/amd64/boot-screens/rqtxt.cfg
label auto
        menu label ^Automated install
        kernel debian-installer/amd64/linux
        append auto=true priority=critical vga=788 initrd=debian-installer/amd64/initrd.gz --- quiet

To:

label expert
        menu label ^Expert install
        kernel debian-installer/amd64/linux
        append priority=low console=ttyS1,115200n8 initrd=debian-installer/amd64/initrd.gz --- 
include debian-installer/amd64/boot-screens/rqtxt.cfg
label auto
        menu label ^Automated install
        kernel debian-installer/amd64/linux
        append auto=true priority=critical console=ttyS1,115200n8 initrd=debian-installer/amd64/initrd.gz --- quiet
rqtxt.cfg

From:

label rescue
        menu label ^Rescue mode
        kernel debian-installer/amd64/linux
        append vga=788 initrd=debian-installer/amd64/initrd.gz rescue/enable=true --- quiet

To:

label rescue
        menu label ^Rescue mode
        kernel debian-installer/amd64/linux
        append console=ttyS1,115200n8 initrd=debian-installer/amd64/initrd.gz rescue/enable=true --- quiet
syslinux.cfg

From:

# D-I config version 2.0
# search path for the c32 support libraries (libcom32, libutil etc.)
path debian-installer/amd64/boot-screens/
include debian-installer/amd64/boot-screens/menu.cfg
default debian-installer/amd64/boot-screens/vesamenu.c32
prompt 0
timeout 0

To:

serial 1 115200
console 1
# D-I config version 2.0
# search path for the c32 support libraries (libcom32, libutil etc.)
path debian-installer/amd64/boot-screens/
include debian-installer/amd64/boot-screens/menu.cfg
default debian-installer/amd64/boot-screens/vesamenu.c32
prompt 0
timeout 0
txt.cfg

From:

default install
label install
        menu label ^Install
        menu default
        kernel debian-installer/amd64/linux
        append vga=788 initrd=debian-installer/amd64/initrd.gz --- quiet

To:

default install
label install
        menu label ^Install
        menu default
        kernel debian-installer/amd64/linux
        append console=ttyS1,115200n8 initrd=debian-installer/amd64/initrd.gz --- quiet

Perform the install ^

Connect to the serial-over-LAN and get started. If the server doesn’t have anything currently installed then it should go straight to trying PXE boot. If it does have something on the storage that it would boot then you will have to use F12 at the BIOS screen to convince it to jump straight to PXE boot.

$ ssh ADMIN@192.168.1.22
ADMIN@192.168.1.22's password:
 
ATEN SMASH-CLP System Management Shell, version 1.05
Copyright (c) 2008-2009 by ATEN International CO., Ltd.
All Rights Reserved 
 
 
-> cd /system1/sol1
/system1/sol1
 
-> start
/system1/sol1
press <Enter>, <Esc>, and then <T> to terminate session
(press the keys in sequence, one after the other)
 
Intel(R) Boot Agent GE v1.5.13                                                  
Copyright (C) 1997-2013, Intel Corporation                                      
 
CLIENT MAC ADDR: 0C C4 7A 7C 28 40  GUID: 00000000 0000 0000 0000 0CC47A7C2840  
CLIENT IP: 192.168.2.22  MASK: 255.255.255.0  DHCP IP: 192.168.2.252             
GATEWAY IP: 192.168.2.1
 
PXELINUX 6.03 PXE 20150107 Copyright (C) 1994-2014 H. Peter Anvin et al    


                 ┌───────────────────────────────────────┐
                 │ Debian GNU/Linux installer boot menu  │
                 ├───────────────────────────────────────┤
                 │ Install                               │
                 │ Advanced options                    > │
                 │ Help                                  │
                 │ Install with speech synthesis         │
                 │                                       │
                 │                                       │
                 │                                       │
                 │                                       │
                 │                                       │
                 │                                       │
                 └───────────────────────────────────────┘


              Press ENTER to boot or TAB to edit a menu entry
 
 
  ┌───────────────────────┤ [!!] Select a language ├────────────────────────┐
  │                                                                         │
  │ Choose the language to be used for the installation process. The        │
  │ selected language will also be the default language for the installed   │
  │ system.                                                                 │
  │                                                                         │
  │ Language:                                                               │
  │                                                                         │
  │                               C                                         │
  │                               English                                   │
  │                                                                         │
  │     <Go Back>                                                           │
  │                                                                         │
  └─────────────────────────────────────────────────────────────────────────┘


<Tab> moves; <Space> selects; <Enter> activates buttons

…and now the installation proceeds as normal.

At the end of this you should be left with a system that uses ttyS1 for its console. You may need to tweak that depending on whether you want the VGA console also.

F11 and F12 over serial

I always seem to forget this one.

To pass F11 or F12 over a serial connection (either real serial or Serial-over-LAN IPMI), it’s Escape followed by ! (Shift+1) or @ (Shift+') respectively.

Note that on a US keyboard ! and @ would be next to each other above the 1 and 2 keys so that would make some vague kind of sense as alternatives to F11 and F12. But it’s literally the @ that matters and since I’m using a UK keyboard then it is Shift+'.

(╯°□°)╯︵ ┻━┻)