…when you run a Xen device backend (commonly dom0) on a kernel version earlier than 4.10, e.g. Debian stable.
TL;DR ^
Xen netback devices used 32-bit counters until that bug was fixed and released in kernel version 4.10.
On a kernel with that bug you will see counter wraps much sooner than you would expect, and if the interface is doing enough traffic for there to be multiple wraps in 5 minutes, your monitoring will no longer be accurate.
The problem ^
A high-bandwidth VPS customer reported that the bandwidth figures presented by BitFolk’s monitoring bore no resemblance to their own statistics gathered from inside their VPS. Their figures were a lot higher.
About octet counters ^
The Linux kernel maintains byte/octet counters for its network interfaces. You can view them in /sys/class/net/<interface>/statistics/*_bytes.
They’re a simple count of bytes transferred, and so the count always goes up. Typically these are 64-bit unsigned integers so their maximum value would be 18,446,744,073,709,551,615 (264-1).
When you’re monitoring bandwidth use the monitoring system records the value and the timestamp. The difference in value over a known period allows the monitoring system to work out the rate.
Wrapping ^
Monitoring of network devices is often done using SNMP. SNMP has 32-bit and 64-bit counters.
The maximum value that can be held in a 32-bit counter is 4,294,967,295. As that is a byte count, that represents 34,359,738,368 bits or 34,359.74 megabits. Divide that by 300 (seconds in 5 minutes) and you get 114.5. Therefore if the average bandwidth is above 114.5Mbit/s for 5 minutes, you will overflow a 32-bit counter. When the counter overflows it wraps back through zero.
Wrapping a counter once is fine. We have to expect that a counter will wrap eventually, and as counters never decrease, if a new value is smaller than the previous one then we know it has wrapped and can still work out what the rate should be.
The problem comes when the counter wraps more than once. There is no way to tell how many times it has wrapped so the monitoring system will have to assume the answer is once. Once traffic reaches ~229Mbit/s the counters will be wrapping at least twice in 5 minutes and the statistics become meaningless.
64-bit counters to the rescue ^
For that reason, network traffic is normally monitored using 64-bit counters. You would have to have a traffic rate of almost 492 Petabit/s to wrap a 64-bit byte counter in 5 minutes.
The thing is, I was already using 64-bit SNMP counters.
Examining the sysfs files ^
I decided to remove SNMP from the equation by going to the source of the data that SNMP uses: the kernel on the device being monitored.
As mentioned, the kernel’s interface byte counters are exposed in sysfs at /sys/class/net/<interface>/statistics/*_bytes. I dumped out those values every 10 seconds and watched them scroll in a terminal session.
What I observed was that these counters, for that particular customer, were wrapping every couple of minutes. I never observed a value greater than 8,469,862,875. That’s larger than a 32-bit counter would hold, but very close to what a 33 bit counter would hold (8,589,934,591).
64-bit counters not to the rescue ^
Once I realised that the kernel’s own counters were wrapping every couple of minutes inside the kernel it became clear that using 64-bit counters in SNMP was not going to help at all, and multiple wraps would be seen in 5 minutes.
What a difference a minute makes ^
To test the hypothesis I switched to 1-minute polling. Here’s what 12 hours of real data looks like under both 5- and 1-minute polling.
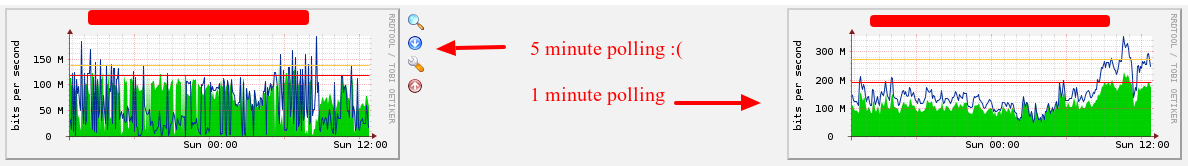
As you can see that is a pretty dramatic difference.
The bug ^
By this point, I’d realised that there must be a bug in Xen’s netback driver (the thing that makes virtual network interfaces in dom0).
I went searching through the source of the kernel and found that the counters had changed from an unsigned long in kernel version 4.9 to a u64 in kernel version 4.10.
Of course, once I knew what to search for it was easy to unearth a previous bug report. If I’d found that at the time of the initial report that would have saved 2 days of investigation!
Even so, the fix for this was only committed in February of this year so, unfortunately, is not present in the kernel in use by the current Debian stable. Nor in many other current distributions.
For Xen set-ups on Debian the bug could be avoided by using a backports kernel or packaging an upstream kernel.
Or you could do 1-minute polling as that would only wrap one time at an average bandwidth of ~572Mbit/s and should be safe from multiple wraps up to ~1.1Gbit/s.
Inside the VPS the counters are 64-bit so it isn’t an issue for guest administrators.